Marginal cost and average total cost | Microeconomics | Khan Academy
TLDRThe video script explores the economics of entering the orange juice business, focusing on cost analysis. It breaks down costs into fixed and variable components, with fixed costs including the purchase of a robotic orange juicer and a one-year contract for employees. Variable costs are associated with the production volume, primarily the cost of oranges and transportation, which initially decrease due to economies of scale and negotiation power but increase as local supplies are exhausted. The script calculates average costs per gallon and introduces the concept of marginal cost, illustrating how costs change with incremental production. The use of a spreadsheet allows for easy calculation and visualization of cost trends, highlighting the relationship between average and marginal costs as production scales up.
Takeaways
- 🧑💼 The speaker is entering the orange juice business and will produce a certain number of gallons per week.
- 💰 The fixed cost for the business is $1,000, which includes rent for a robotic orange juicer and employee contracts.
- 🍊 Variable costs are dependent on the amount of orange juice produced, primarily the cost of oranges and their transportation.
- 📈 There are economies of scale in play, as the incremental variable cost decreases with increased production volume initially.
- 🔍 The speaker negotiates better prices for oranges and transportation as production volume increases, reflecting increased buying power.
- 📦 As production volume continues to grow, the speaker may exhaust local supply and face higher costs from more distant or less preferable suppliers.
- 📊 Total costs are calculated as the sum of fixed and variable costs, which can be used to determine the cost per gallon of orange juice produced.
- 📉 Average fixed costs decrease as production volume increases, as the same fixed costs are spread over more units.
- 🔢 Average variable costs and average total costs are calculated by dividing the respective costs by the total number of gallons produced.
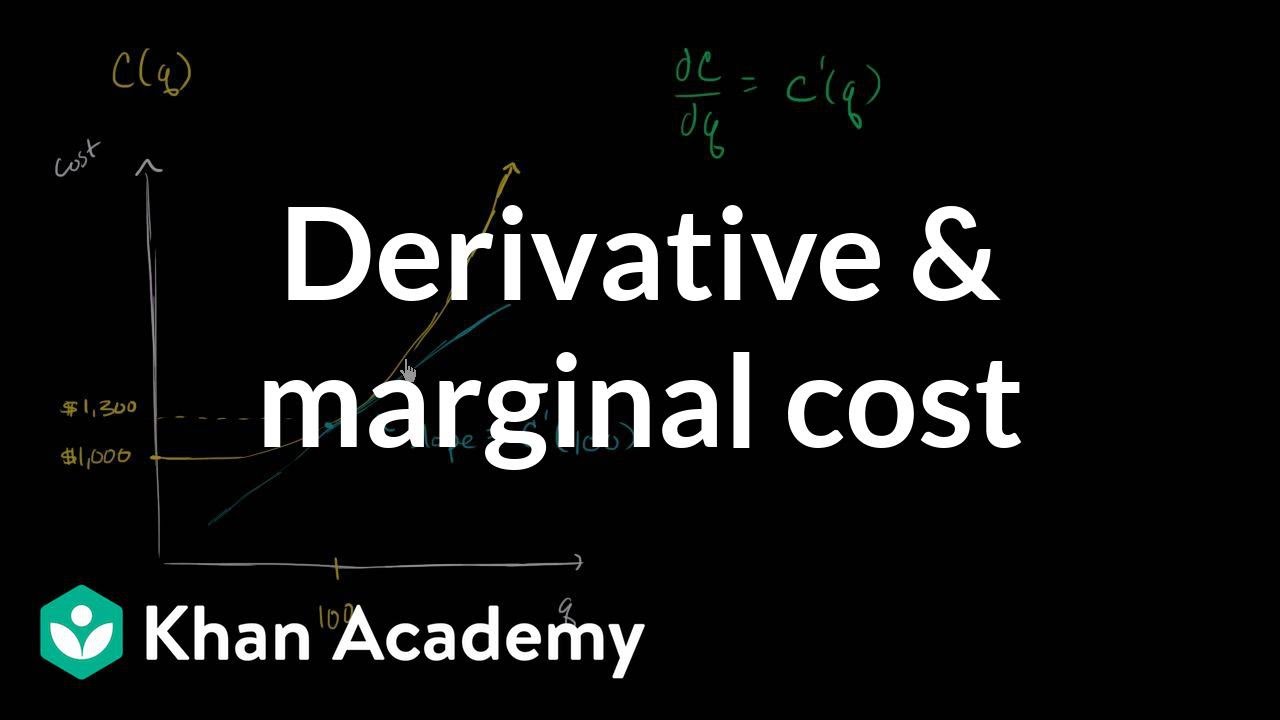
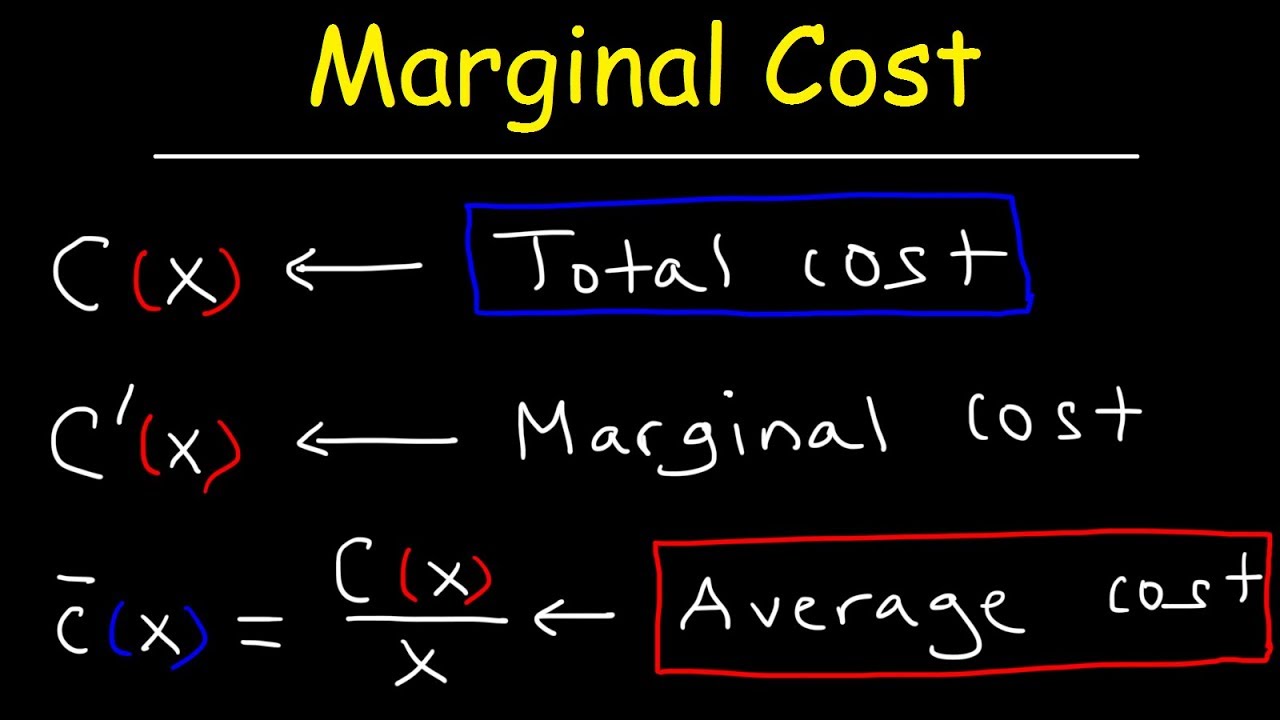
- 📋 Marginal cost is the change in total cost divided by the change in production volume, indicating the cost of producing an additional unit.
- 📈 The marginal cost curve shows how costs change with each additional unit produced, reflecting the initial high costs that decrease with scale and then potentially increase again.
- 📊 The average total cost curve starts high and decreases as fixed costs are spread over more units, showing the effect of economies of scale.
Q & A
What is the main topic of the video?
-The video discusses the economics of starting an orange juice business, focusing on fixed and variable costs, and how they change as production increases.
What is the fixed cost for the business mentioned in the script?
-The fixed cost for the business is $1,000, which includes the rent for the robotic orange juicer and the salaries for employees operating the machine.
What is the significance of the super robotic orange juicer in the context of the video?
-The super robotic orange juicer is significant as it represents a capital investment that leads to fixed costs, and it is assumed to be capable of producing any amount of orange juice listed in the script.
How does the cost of oranges and their transportation change as production increases?
-Initially, as production increases, the incremental variable cost decreases due to economies of scale and better negotiation power with suppliers. However, after a certain point, the cost increases as the local suppliers are tapped out, and more expensive suppliers or transportation costs come into play.
What does the term 'incremental variable cost' refer to in the context of the video?
-Incremental variable cost refers to the change in total variable costs when producing an additional unit of product—in this case, the cost difference of producing the next 1,000 gallons of orange juice compared to the previous 1,000.
How is the total cost of producing orange juice calculated?
-The total cost is calculated by adding the fixed costs to the variable costs associated with the production level of orange juice.
What does the average fixed cost represent?
-The average fixed cost represents the fixed cost per gallon of orange juice produced, which is calculated by dividing the total fixed cost by the total number of gallons produced.
How is the average variable cost per gallon calculated?
-The average variable cost per gallon is calculated by dividing the total variable costs by the total number of gallons of orange juice produced.
What is the formula used to calculate the average total cost per gallon?
-The average total cost per gallon is calculated by dividing the sum of the total fixed and variable costs by the total number of gallons produced.
What is the concept of marginal cost in the context of the video?
-Marginal cost is the cost of producing one more unit of a good—in this case, the cost of producing an additional gallon of orange juice, calculated by the change in total cost divided by the change in quantity produced.
How does the marginal cost change as production increases?
-Initially, the marginal cost decreases due to economies of scale and increased negotiation power. After reaching a certain production level, the marginal cost begins to increase as the business sources oranges from more expensive or more distant suppliers.
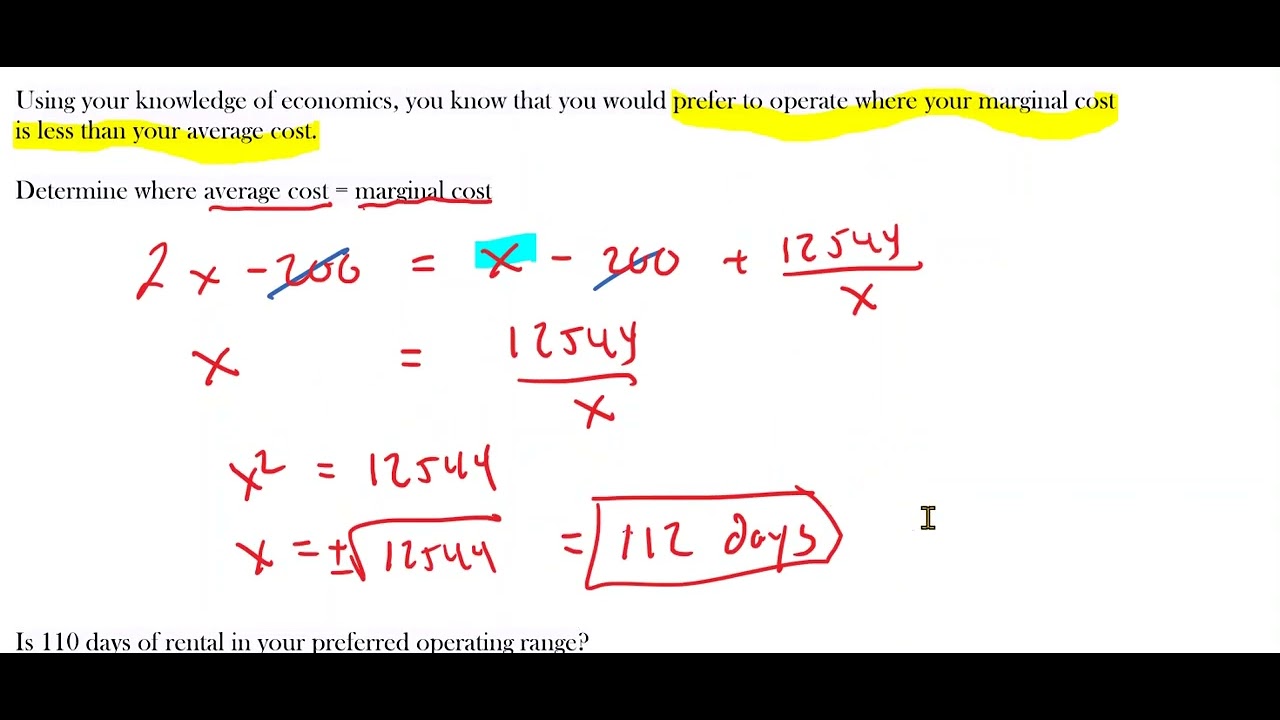
What does the difference between the average total cost and the average variable cost represent?
-The difference between the average total cost and the average variable cost represents the average fixed cost, which decreases as production increases because the fixed costs are spread over a larger quantity of output.
Outlines
🧑💼 Orange Juice Business Economics
The video script introduces the concept of entering the orange juice business with a focus on weekly production. It outlines fixed costs, such as the rent for a robotic orange juicer and employee salaries, which are assumed to be unchangeable for a year. Variable costs are dependent on the amount of juice produced, including the cost of oranges and transportation. The script discusses economies of scale and the impact of purchasing and shipping volume on cost negotiations. It also explains the calculation of total costs, average fixed costs, average variable costs, and average total costs per gallon of orange juice produced. The marginal cost is introduced as the change in total cost divided by the change in quantity, and the script uses Excel for calculations and plotting the cost curves.
📈 Cost Analysis and Economies of Scale
This paragraph delves into the cost dynamics as production volume increases. It discusses how the initial cost of oranges is high due to being a minor buyer but decreases as the business becomes a larger purchaser, leveraging economies of scale. The marginal cost curve is highlighted to show the cost of producing additional gallons of orange juice, which initially declines as the business gains negotiating power but then increases as it exhausts local suppliers and has to source from more expensive or distant ones. The average variable cost is contrasted with the marginal cost to illustrate the difference between the cost of all oranges produced and the cost of the next set of oranges. The average total cost is shown to decrease as fixed costs are spread over a larger volume of production, creating a gap between the average total cost and the average variable cost, which represents the average fixed cost.
Mindmap
Keywords
💡Orange Juice Business
💡Fixed Costs
💡Variable Costs
💡Economies of Scale
💡Incremental Variable Cost
💡Total Costs
💡Average Fixed Cost
💡Average Variable Cost
💡Average Total Cost
💡Marginal Cost
💡Spreadsheets
Highlights
The video discusses launching an orange juice business and analyzes the costs involved.
Fixed costs are assumed to be $1,000 per week, including rent for a robotic orange juicer and employee salaries.
Variable costs depend on the amount of orange juice produced, primarily the cost of oranges and transportation.
Economies of scale are observed as the incremental variable cost decreases when producing more oranges due to better supplier negotiations.
Once local suppliers are tapped out, the incremental variable cost increases as more expensive suppliers and transportation are needed.
Total costs are calculated as the sum of fixed and variable costs.
Average fixed cost per gallon is calculated by dividing fixed costs by total gallons produced.
Average variable cost per gallon is calculated by dividing variable costs by total gallons produced, around 50 cents for the first 1,000 gallons.
Average total cost per gallon is the sum of average fixed and variable costs.
Marginal cost is calculated as the change in total cost divided by the change in gallons produced.
The marginal cost curve shows how much the next incremental oranges cost, capturing economies of scale and increased costs after tapping out local suppliers.
The average variable cost curve is flatter as it averages the cost of all oranges, while the marginal cost focuses on the cost of the next set of oranges.
The average total cost curve shows the gap between fixed and variable costs getting smaller as more gallons are produced, representing the decreasing average fixed cost.
Spreadsheets are used to easily calculate and visualize the cost curves and relationships between different cost types.
The video provides a practical example of cost analysis in a hypothetical business scenario, making economic concepts more tangible.
Excel formulas and calculations are demonstrated to calculate average and marginal costs.
The importance of understanding fixed vs variable costs, economies of scale, and cost analysis for pricing and profitability is emphasized.
Transcripts
Browse More Related Video
Marginal cost & differential calculus | Applications of derivatives | AP Calculus AB | Khan Academy

Marginal Revenue, Average Cost, Profit, Price & Demand Function - Calculus

Revenue, Profits, and Price: Crash Course Economics #24
Marginal and Average Cost
Marginal Cost and Average Total Cost
Math 1325 Lecture 12 4
5.0 / 5 (0 votes)
Thanks for rating: