The basic steps of hypothesis testing
TLDRThis lecture introduces the fundamental concepts of hypothesis testing, focusing on the null hypothesis (H0) and the alternative hypothesis (H1). It outlines the five key steps in hypothesis testing: stating hypotheses, selecting a significance level (commonly 0.05), collecting data, calculating the p-value, and comparing it to the significance level to decide whether to reject H0. The lecture illustrates these steps with an example comparing plant heights in two fields, explaining how to interpret p-values in relation to the significance level. It also touches on one-sided versus two-sided alternative hypotheses and emphasizes the importance of choosing the appropriate hypothesis type before conducting an experiment.
Takeaways
- 🔍 A hypothesis is a statement about a population that can be tested for its truth or falsity, such as comparing the effectiveness of two drugs or the average height of plants in different fields.
- 🧐 Hypothesis testing involves two main hypotheses: the null hypothesis (H0), which assumes no difference or normalcy, and the alternative hypothesis (H1), which suggests a difference or abnormality.
- 📝 The five steps of statistical hypothesis testing are: stating the null and alternative hypotheses, choosing a significance level (alpha), performing the experiment and selecting a statistical test, computing the p-value, and comparing the p-value to alpha to make a decision.
- 📉 The null hypothesis is usually denoted by H0 and states that there is no difference or relationship, while the alternative hypothesis, denoted by H1, suggests otherwise.
- 📊 The significance level (alpha) is a threshold for the p-value and is commonly set at 0.05, indicating a 95% confidence level in the results.
- 🌾 An example given in the script involves testing if plants in field A are taller or shorter than those in field B, with the null hypothesis stating no difference in mean height.
- 📚 The choice of statistical test depends on the data collected, such as an independent two-sample t-test for comparing means from two different groups.
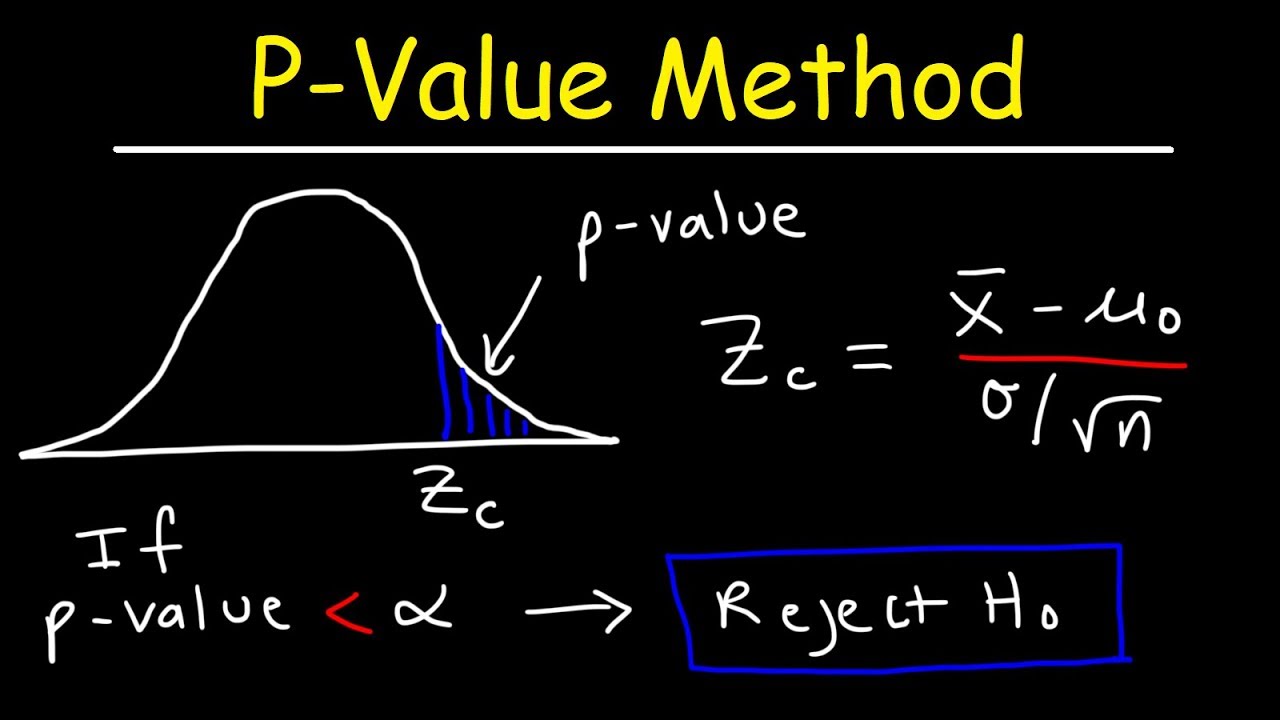
- 📊 The p-value is a probability that quantifies the strength of evidence against the null hypothesis and is compared to the predetermined alpha level to decide whether to reject H0.
- ✅ If the p-value is less than alpha (e.g., p-value of 0.02 with alpha set at 0.05), the null hypothesis is rejected in favor of the alternative hypothesis, suggesting a significant difference.
- ❌ Conversely, if the p-value is greater than alpha (e.g., p-value of 0.45 with alpha set at 0.05), the null hypothesis is not rejected, indicating no significant difference found.
- 🔄 The choice between a one-sided or two-sided alternative hypothesis depends on the study's specific objectives, with the two-sided hypothesis being more common as it allows for any difference to be detected.
Q & A
What is a hypothesis in the context of statistical testing?
-A hypothesis is a statement that can be tested for its truth or falsehood, such as a claim that one drug is more effective than another or that there is a difference in a certain characteristic between two groups.
What are the two types of hypotheses typically tested in statistical hypothesis testing?
-The two types of hypotheses are the null hypothesis (H0), which assumes no difference or normality, and the alternative hypothesis (H1), which assumes a difference or deviation from normality.
What does the null hypothesis represent in a statistical test?
-The null hypothesis represents a conservative view that there is no difference, no relationship, or that everything is normal. It is the default position that is tested against.
What is the significance level (alpha) in a statistical test and why is it usually set to 0.05?
-The significance level (alpha) is a threshold value for the p-value that determines when to reject the null hypothesis. It is usually set to 0.05 because it corresponds to a 95% confidence level, which is a common standard in statistical analysis.
What are the five steps involved in the procedure of statistical hypothesis testing?
-The five steps are: 1) State the null and alternative hypotheses, 2) Choose a significance level alpha, 3) Perform the experiment and select an appropriate statistical test, 4) Compute the p-value, and 5) Compare the p-value to the significance level to make a decision about the null hypothesis.
What is a p-value and how is it used in hypothesis testing?
-A p-value is a statistic that measures the strength of the evidence against the null hypothesis. It is compared to the significance level to decide whether to reject the null hypothesis. If the p-value is less than the significance level, the null hypothesis is rejected.
What is the difference between a one-sided and a two-sided alternative hypothesis?
-A one-sided alternative hypothesis states that one group's characteristic is either greater than or less than the other group's, while a two-sided alternative hypothesis states that there is a difference without specifying the direction, testing for any difference between the two groups.
Why is it important to decide on a one-sided or two-sided hypothesis before starting an experiment?
-Deciding on the type of hypothesis before the experiment ensures that the study is designed and analyzed correctly. It also avoids the risk of bias or manipulation of results after observing the data, which could lead to incorrect conclusions.
What does it mean to reject the null hypothesis in favor of the alternative hypothesis?
-Rejecting the null hypothesis in favor of the alternative means that the data provides strong evidence against the assumption of no difference or normality. It suggests that the alternative hypothesis, which posits a difference or abnormality, is more likely to be true.
Why can't we be 100% certain of the correct hypothesis after rejecting the null hypothesis based on a sample?
-We can't be 100% certain because we are only working with a sample of the population. There is always a chance that the sample does not fully represent the entire population, and thus our conclusions may not hold true for all members of the population.
What is the conclusion when the p-value is greater than the significance level?
-When the p-value is greater than the significance level, we do not reject the null hypothesis. This suggests that there is not enough evidence to conclude that there is a significant difference or relationship, based on the data collected.
How does the process of hypothesis testing apply to different statistical tests?
-The process of hypothesis testing is a general framework that applies to all statistical tests. Regardless of the specific test used, the steps of stating hypotheses, setting a significance level, collecting data, computing the p-value, and making a decision based on the p-value versus the significance level remain the same.
Outlines
🔬 Introduction to Hypothesis Testing
This paragraph introduces the concept of hypothesis testing, explaining that a hypothesis is a statement that can be tested for its truth or falsehood. It distinguishes between the null hypothesis (H0), which assumes no difference or normality, and the alternative hypothesis (H1), which posits a difference or abnormality. The paragraph outlines the five steps involved in hypothesis testing: stating hypotheses, choosing a significance level (alpha), conducting the experiment and selecting a statistical test, computing the p-value, and comparing it to alpha to make a decision. An example involving comparing plant heights in two fields is used to illustrate these steps, emphasizing the process of rejecting or not rejecting the null hypothesis based on the p-value.
📊 Understanding P-values and Hypothesis Decisions
This paragraph delves deeper into the concept of p-values, which are computed at the end of a statistical analysis and can range between 0 and 1. It explains that a p-value less than the predetermined alpha level (commonly set at 0.05) leads to the rejection of the null hypothesis in favor of the alternative hypothesis. The paragraph uses an example where a p-value of 0.02 results in the rejection of the null hypothesis, suggesting a significant difference in plant heights between two fields. Conversely, a p-value of 0.45 would not lead to the rejection of the null hypothesis, indicating no significant difference. The paragraph also discusses the difference between two-sided and one-sided alternative hypotheses, highlighting the importance of choosing the appropriate type before conducting the experiment. It concludes by emphasizing that the decision-making process in hypothesis testing is consistent across various statistical tests.
Mindmap
Keywords
💡Hypothesis
💡Null Hypothesis (H0)
💡Alternative Hypothesis (H1)
💡Significance Level (Alpha)
💡P-Value
💡Statistical Test
💡Sample
💡Mean Height
💡Two-Sided Alternative Hypothesis
💡One-Sided Hypothesis
Highlights
A hypothesis is a statement that can be tested for its truth or falsehood, such as comparing the effectiveness of two drugs or the average height of plants in different fields.
In hypothesis testing, the null hypothesis (H0) represents a conservative view that there is no difference or relationship, while the alternative hypothesis (H1) suggests there is a difference or relationship.
The five steps of statistical hypothesis testing include stating hypotheses, choosing a significance level, performing the experiment and selecting a statistical test, computing the p-value, and comparing it to the significance level.
The null hypothesis is typically denoted by H0 and states there is no difference in the mean height between two populations, such as plants in fields A and B.
The alternative hypothesis is denoted by H1 and posits a difference in the mean height between the two populations, indicating a potential difference.
The significance level (alpha) is a threshold for the p-value, often set at 0.05, representing the probability of rejecting the null hypothesis when it is true.
Data collection involves taking a sample from each population and measuring relevant variables, such as the height of plants.
An appropriate statistical test must be selected based on the data, such as an independent two-sample t-test for comparing means.
The p-value is computed using the chosen statistical test and represents the probability of observing the data, or something more extreme, if the null hypothesis is true.
If the p-value is less than the significance level (alpha), the null hypothesis is rejected in favor of the alternative hypothesis.
A p-value greater than alpha indicates that there is not enough evidence to reject the null hypothesis, suggesting no significant difference.
The significance level is predetermined and typically set to 0.05, while the p-value is computed after the analysis and can range from 0 to 1.
Rejecting the null hypothesis implies a significant difference in the mean height between the two populations based on the sample data.
When a significant difference is found, it is possible to draw more specific conclusions about which population has a larger mean, such as field B having taller plants than field A.
A one-sided hypothesis can be formulated if there is a specific direction of difference expected, such as plants in population A being taller than in population B.
The choice between a one-sided or two-sided hypothesis should be made before the experiment based on the study's objectives.
The two-sided alternative hypothesis is more common because it does not assume the direction of the difference, allowing for a more open-ended analysis.
The process of hypothesis testing is consistent across different statistical tests, providing a foundational framework for statistical analysis.
Transcripts
Browse More Related Video
Hypothesis testing: step-by-step, p-value, t-test for difference of two means - Statistics Help
P-Value Method For Hypothesis Testing

P Value and Hypothesis Testing Simplified|P-value and Hypothesis testing concepts in Statistics

P-value in statistics: Understanding the p-value and what it tells us - Statistics Help

Null and Alternate Hypothesis - Statistical Hypothesis Testing - Statistics Course

05 - Using P-Values in Hypothesis Testing (Compare P Value to Level of Significance)
5.0 / 5 (0 votes)
Thanks for rating: