9.1.3 Two Proportions - Example, Critical Value Method, Normal Approximation
TLDRThis video tutorial explains the critical value method for testing claims about two proportions, contrasting it with the p-value method. It begins by reviewing prerequisites like having independent random samples and sufficient successes and failures. The process involves formulating hypotheses, calculating sample proportions, and plotting the sampling distribution. The critical value method diverges by determining the test type (two-tailed, left-tailed, or right-tailed) and identifying critical regions on the standard normal distribution graph. The tutorial uses a Burger King vs. McDonald's accuracy rates example to demonstrate the steps, ultimately rejecting the null hypothesis that the two restaurants have the same accuracy rates.
Takeaways
- 📚 The video discusses learning outcome number three of lesson 9.1, focusing on testing a claim about two proportions using the critical value method, also known as the traditional method.
- 🔍 The process begins with checking the requirements for testing a claim about two proportions, which includes having two independent simple random samples and at least five successes and five failures in each sample.
- 📉 A normal approximation to the binomial distribution is used, implying that the samples are large enough to justify this approach.
- 📝 The claim is written in symbolic form to infer the null and alternative hypotheses, with the null hypothesis assuming equal proportions and the alternative allowing for unequal proportions.
- 📊 Sample proportions and sizes are computed, and the sampling distribution of the difference in proportions is graphed under the assumption of the null hypothesis being true.
- 🧐 The test statistic is computed to determine if the observed difference in proportions is an extreme value under the null hypothesis.
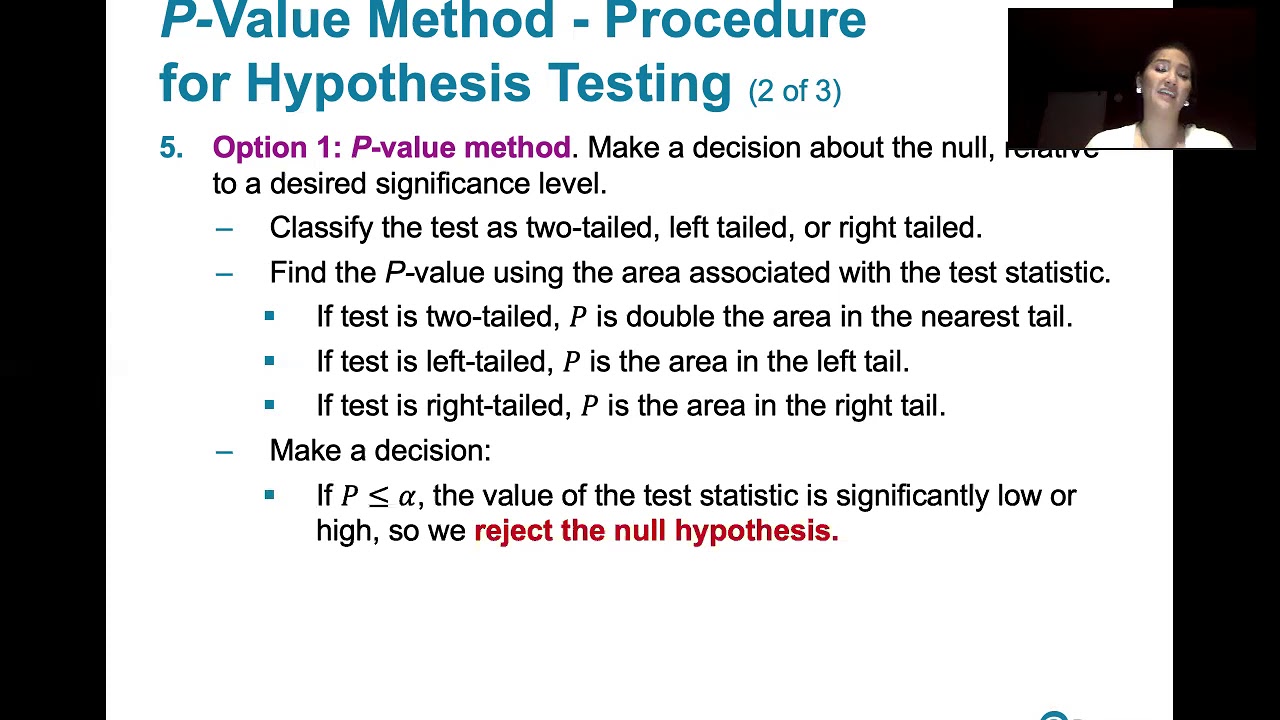
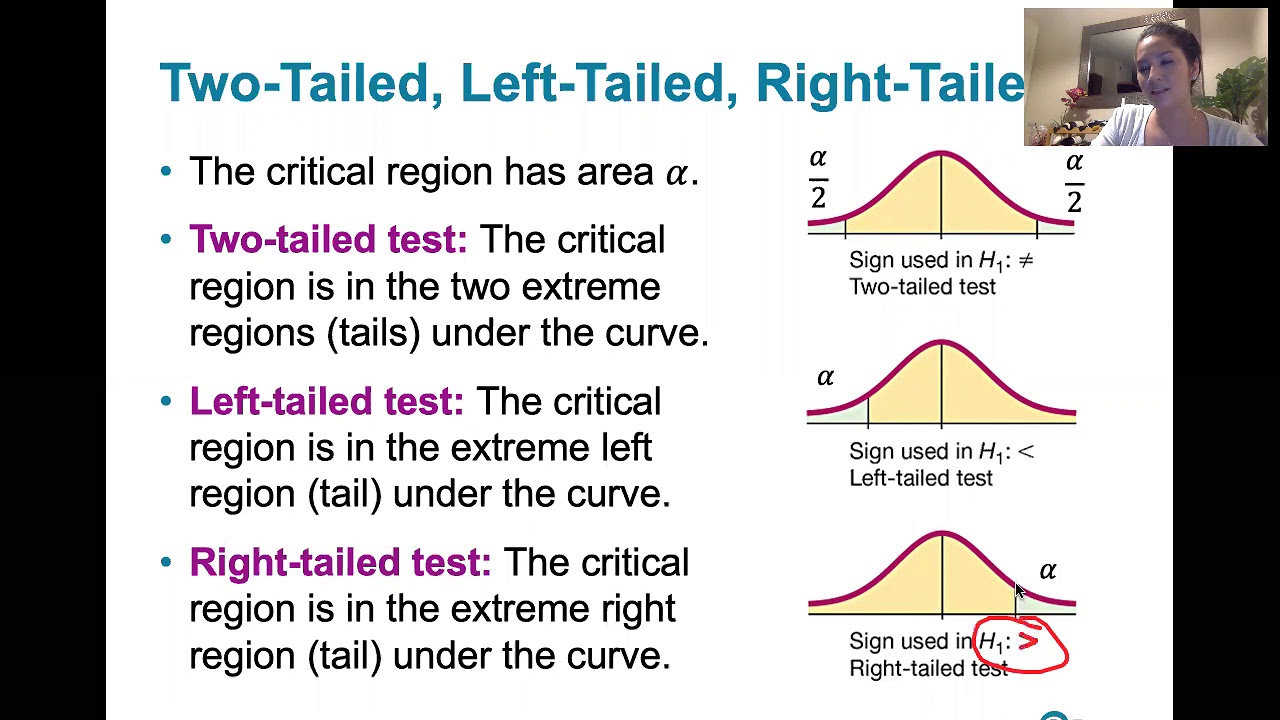
- 📉 In the critical value method, after computing the test statistic, the type of test (two-tailed, left-tailed, or right-tailed) is determined, and the critical region is sketched and shaded.
- 🔢 Critical values are found, which are the z-scores that separate the critical region from the rest of the distribution, helping to decide whether to reject or fail to reject the null hypothesis.
- 🔄 The critical value method diverges from the p-value method after computing the test statistic, as it involves comparing the test statistic to critical values rather than computing a p-value.
- 🍔 An example problem involving Burger King and McDonald's drive-through order accuracy rates is used to illustrate the method, with a significance level of 0.05.
- 📉 The example demonstrates the computation of the test statistic, determination of critical values, and the decision to reject or not reject the null hypothesis based on the test statistic's position relative to the critical region.
Q & A
What are the two methods mentioned in the script for testing a claim about two proportions?
-The two methods mentioned are the p-value method and the critical value method, also known as the traditional method.
What are the initial requirements for testing a claim about two proportions?
-The initial requirements include having two simple random samples, ensuring the samples are independent, and having at least five successes and five failures in each sample.
Why is a normal approximation to the binomial distribution considered appropriate in this context?
-A normal approximation is appropriate because it's implied by the requirement of having at least five successes and five failures in each sample, which allows for the use of the Central Limit Theorem.
What is the purpose of writing the claim in symbolic form?
-Writing the claim in symbolic form helps to infer the null and alternative hypotheses, which are essential for setting up the hypothesis test.
How does the sampling distribution of p1 hat minus p2 hat help in the hypothesis testing process?
-The sampling distribution of p1 hat minus p2 hat, assuming the null hypothesis is true, helps to determine if the observed sample statistic is an extreme value, indicating a significant difference between the two proportions.
What is the difference between the critical value method and the p-value method after computing the test statistic?
-The critical value method involves determining the critical region and comparing the test statistic to the critical values, whereas the p-value method involves comparing the computed p-value to the significance level alpha.
What is the significance of the critical region in the critical value method?
-The critical region is the area under the sampling distribution where the test statistic values are considered significantly high or low, indicating that the null hypothesis should be rejected.
How does the decision to reject or fail to reject the null hypothesis relate to the evidence against the original claim?
-Rejecting the null hypothesis indicates there is sufficient evidence against the original claim, suggesting a significant difference between the two proportions. Failing to reject the null hypothesis means there is not enough evidence to conclude a difference.
In the provided example about Burger King and McDonald's drive-through orders, what is the null hypothesis?
-The null hypothesis is that Burger King and McDonald's have the same accuracy rates, symbolically represented as p1 = p2.
What is the role of the pooled sample proportion (p bar) in calculating the test statistic?
-The pooled sample proportion (p bar) serves as an estimate of the common value of p1 and p2 under the assumption of the null hypothesis, and it is used in the formula to standardize the test statistic for comparison to the standard normal distribution.
Outlines
📚 Introduction to Testing Claims about Proportions
This paragraph introduces the process of testing a claim about two proportions using the critical value method, also known as the traditional method. It emphasizes the importance of checking the requirements for testing such claims, including having two independent simple random samples with at least five successes and failures in each. The paragraph reviews the initial steps common to both the p-value method and the critical value method, such as writing the claim symbolically, inferring null and alternative hypotheses, computing sample proportions, and graphing the sampling distribution. The critical value method diverges after computing the test statistic, requiring the determination of the type of test (two-tailed, left-tailed, or right-tailed) and the sketching of the critical region based on the significance level alpha.
🍔 Burger King vs. McDonald's: Hypothesis Testing
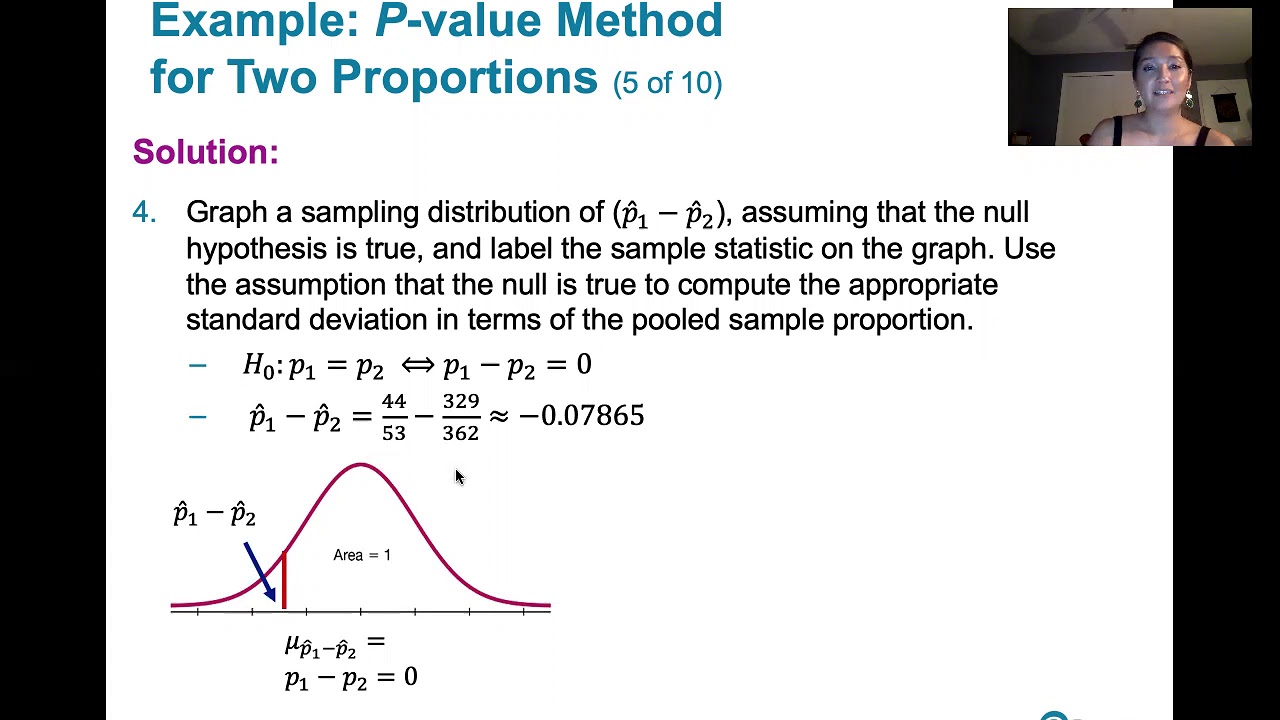
The second paragraph presents a specific problem involving a study of drive-through orders at Burger King and McDonald's, aiming to test the claim that both fast-food chains have the same accuracy rates. The paragraph outlines the steps for hypothesis testing using the critical value method, starting with checking the requirements for the normal approximation to the binomial distribution. It then moves on to identifying the null and alternative hypotheses based on the claim of equal accuracy rates. The computation of sample proportions (p1 hat and p2 hat) for both chains is detailed, followed by the graphing of the sampling distribution of p1 hat minus p2 hat under the assumption of the null hypothesis being true. The paragraph concludes with the computation of the test statistic using the pooled sample proportion, leading to a z-score that will be used for hypothesis testing in the subsequent steps.
📉 Graphical Representation and Test Statistic Calculation
This paragraph focuses on the graphical representation of the sampling distribution of the difference between the sample proportions (p1 hat minus p2 hat) and the calculation of the test statistic. It explains that if the null hypothesis is true, the mean of this distribution is zero, indicating that p1 and p2 are equal. The paragraph details the process of computing the pooled sample proportion (p bar) and its complement (q bar), which are then used in the formula for the test statistic z. The calculation results in a z-score of negative 3.06, indicating that the observed difference in proportions is 3.06 standard deviations below the mean, suggesting a statistically significant difference if the null hypothesis is true.
📊 Critical Value Method: Determining Statistical Significance
The fourth paragraph delves into the critical value method, explaining how to determine whether the test is left-tailed, right-tailed, or two-tailed based on the alternative hypothesis. Since the hypothesis states that the accuracy rates are not equal, a two-tailed test is appropriate. The paragraph describes how to find the critical values corresponding to the significance level alpha, which are the z-scores that separate the critical region from the rest of the distribution. Using table A2 or Excel, the critical values are determined to be plus and minus 1.96 for a 0.05 significance level. The paragraph concludes with a comparison of the test statistic's absolute value to the critical values, indicating a decision to reject the null hypothesis if the test statistic is more extreme.
🚫 Rejecting the Null Hypothesis: Conclusion on Accuracy Rates
The final paragraph summarizes the conclusion drawn from the hypothesis test. It explains that since the absolute value of the test statistic (3.06) is greater than the critical value (1.96), the null hypothesis is rejected, indicating there is sufficient evidence to suggest that the accuracy rates of Burger King and McDonald's are not the same. The paragraph also emphasizes the equivalence of the critical value method and the p-value method, showing that both methods will lead to the same conclusion. It concludes by reiterating the process of comparing either the test statistic to the critical value or the p-value to the significance level alpha, resulting in the rejection of the null hypothesis in this case.
Mindmap
Keywords
💡Critical Value Method
💡P-Value Method
💡Proportions
💡Null Hypothesis
💡Alternative Hypothesis
💡Sample Proportions
💡Standard Deviation
💡Test Statistic
💡Critical Region
💡Significance Level (Alpha)
💡Pooled Sample Proportion
💡Z-Score
Highlights
The video discusses the critical value method, also known as the traditional method, for testing claims about two proportions.
The process begins by checking the requirements for testing claims about two proportions, including having two simple random samples with at least five successes and five failures in each.
A normal approximation to the binomial distribution is appropriate if the conditions are met, allowing for the use of the critical value method.
The null and alternative hypotheses are formulated based on the claim, with the null hypothesis assuming equal proportions and the alternative allowing for inequality.
Sample proportions and sizes are computed, and the sampling distribution of the difference in sample proportions is graphed under the assumption of the null hypothesis.
The test statistic is calculated using the pooled sample proportion to standardize the sampling distribution of the difference in proportions.
The critical value method diverges from the p-value method by determining whether the test is one-tailed or two-tailed and identifying the critical region on the graph.
Critical values are found using the significance level alpha, which defines the area in the tails of the distribution that is considered unlikely to occur by chance.
The decision to reject or fail to reject the null hypothesis is based on whether the test statistic falls within the critical region.
An example using Burger King and McDonald's drive-through order accuracy rates illustrates the application of the critical value method.
The example demonstrates the computation of sample proportions and the test statistic, which indicates how many standard deviations the sample mean is from the hypothesized mean.
Critical values are determined for a two-tailed test, and the test statistic is compared to these values to make a decision about the null hypothesis.
The video explains how to use Excel's NORM.S.INV function to find critical values corresponding to a given probability.
The comparison of the test statistic to the critical values leads to the rejection of the null hypothesis if the test statistic is more extreme than the critical values.
The conclusion of the example addresses the original claim about the equality of accuracy rates between the two restaurants, suggesting there is sufficient evidence to reject the claim.
The video emphasizes that both the critical value method and the p-value method will yield the same result, despite their different approaches to hypothesis testing.
The critical value method compares the test statistic to critical values, while the p-value method compares the area under the curve to the significance level.
The video concludes by reinforcing the understanding that the test statistic's position relative to the critical values or the p-value's relation to alpha will lead to the same conclusion in hypothesis testing.
Transcripts
Browse More Related Video
9.1.2 Two Proportions - Example, P-Value Method, Normal Approximation to the Binomial Distribution

Elementary Stats Lesson #18
9.1.4 Two Proportions - Confidence Intervals for the Difference Between Two Proportions
8.2.1 Testing a Claim About a Proportion - P-value, Critical Value Methods, Normal Approximation
8.1.4 Basics of Hypothesis Testing - The Critical Value Method for a Population Proportion
8.2.2 Testing a Claim About A Proportion - Confidence Interval Method, Comparison to Other Methods
5.0 / 5 (0 votes)
Thanks for rating: