Graphing Exponential Functions with Transformations (Precalculus -College Algebra 53)
TLDRThe video script is an educational guide on graphing exponential functions with various transformations. It emphasizes the importance of understanding the base 'a' of the exponential function, which determines whether the function is increasing or decreasing. The script introduces key points (0, 1) and (1, a), and a horizontal asymptote at y=0, which are crucial for sketching the graph. It then demonstrates how to apply transformations such as vertical and horizontal shifts, reflections, and stretches or compressions by analyzing different components of the exponential function. The guide walks through several examples, illustrating the process of graphing exponentials with bases greater than one, less than one, and even the natural base 'e'. It concludes with a reminder of the techniques used for transformations and a teaser for upcoming content on solving exponentials and the introduction to logarithms.
Takeaways
- 📈 Exponential functions are defined as a constant base raised to a variable exponent and can be either increasing or decreasing based on the value of the base.
- 🔑 Key points for graphing exponential functions are (0, 1) and (1, base), where the base is the value being raised to the power.
- ↔️ Horizontal asymptotes for exponential functions are at y = 0, regardless of the transformations applied to the function.
- 🔄 Transformations such as shifts (left, right, up, down) and reflections (across the x-axis or y-axis) apply to exponential functions in a predictable manner.
- 📐 Vertical shifts are indicated by addition or subtraction after the exponent, while horizontal shifts are indicated by addition or subtraction within the exponent.
- 🔍 To graph an exponential function, first plot the key points, then apply transformations to these points to reflect the function's behavior.
- 🤔 Understanding the order of operations is crucial for correctly identifying the base and exponent in an exponential function, especially when negatives or fractions are involved.
- 📊 The graph of an exponential function with a base greater than 1 will always increase, while a base between 0 and 1 will result in a decreasing graph.
- ✅ To find the y-intercept of an exponential graph, evaluate the function at x = 0, which gives the point where the graph crosses the y-axis.
- 🚫 Remember that the base of an exponential function cannot be negative; any negative signs are multipliers that affect the output values.
- 📈📉 The behavior of the graph (increasing or decreasing) is determined by the base of the exponential function, not by any multipliers or additive terms in the function.
Q & A
What are the two key points of an exponential function?
-The two key points of an exponential function are (0, 1) and (1, a), where 'a' is the base of the exponential function.
What is the role of the horizontal asymptote in graphing exponential functions?
-The horizontal asymptote, typically at y=0, is a reference line that helps in determining the general shape and limits of the exponential function's graph, especially when applying transformations.
How does the base 'a' of an exponential function affect its graph?
-If the base 'a' is greater than 1, the exponential function is always increasing. If the base 'a' is less than 1, the function is decreasing. If the base 'a' equals 1, the graph is a horizontal line, which is not considered a typical exponential function.
What is the effect of adding or subtracting a number after the exponent in an exponential function?
-Adding or subtracting a number after the exponent results in a vertical shift of the graph. If the number is positive, the graph shifts up, and if it's negative, the graph shifts down.
How does a negative base in an exponential function affect the graph?
-A negative base in an exponential function does not change the base itself, which remains positive, but it results in a reflection of the graph across the x-axis.
What is the process for identifying horizontal shifts in an exponential function?
-Horizontal shifts are identified by looking for addition or subtraction within the exponent. If present, it indicates a shift to the left or right, respectively, with the number indicating the magnitude of the shift.
How do you determine the y-intercept of an exponential function?
-To find the y-intercept, set the variable x to 0 and evaluate the function. The resulting value is the y-intercept of the graph.
What is the effect of multiplying the base of an exponential function by a positive constant?
-Multiplying the base of an exponential function by a positive constant results in a vertical stretch or compression of the graph, depending on whether the constant is greater or less than 1.
What is the significance of the order of operations when interpreting a negative base in an exponential function?
-The order of operations dictates that exponents are evaluated before multiplication. A negative base in an exponential function, such as -3^x, is interpreted as -1 * 3^x, meaning the negative sign is outside of the exponentiation, resulting in a reflection across the x-axis.
How does the presence of a fraction as a base in an exponential function affect the graph?
-A fraction as a base in an exponential function, particularly if it's between 0 and 1, results in a graph that decreases towards the horizontal asymptote y=0.
What is the general approach to graphing exponential functions with transformations?
-The general approach involves identifying the base and key points, applying transformations (vertical and horizontal shifts, reflections, and stretches/compressions), and plotting the transformed key points while maintaining the horizontal asymptote.
Outlines
📈 Introduction to Graphing Exponential Functions
The video begins with an introduction to graphing exponential functions, emphasizing the importance of understanding the behavior of these functions. The presenter mentions that the shape of the graph is influenced by the base 'a', where if 'a' is greater than one, the function is always increasing, and if 'a' is less than one, it's decreasing. The video promises to cover graphing with transformations, including shifts and reflections, using key points and a horizontal asymptote at y=0. The process will be demonstrated with five examples, focusing on quantity to show various cases, and later includes examples with Euler's number (e).
📊 Understanding Key Points and Shifts in Exponential Graphs
The paragraph explains the concept of key points in exponential functions, which are (0,1) and (1,a), where 'a' is the base. It details how to identify transformations such as vertical shifts (after the exponential part), horizontal shifts (within the exponent), and how factors in front of the exponential function affect the graph. The example of the function 3^(x-2) is used to illustrate the process of graphing with shifts, emphasizing the importance of placing key points in relation to the shifted axes.
🔍 Identifying Transformations in Exponential Functions
This section delves into identifying different types of transformations in exponential functions, such as vertical and horizontal shifts, and reflections. It explains how to recognize these transformations by looking at the function's structure and provides a method to plot key points according to the shifted axes. The paragraph clarifies that the base of an exponential function cannot be negative and emphasizes the order of operations.
🤔 Dealing with Negative Bases and Multiplicative Effects
The paragraph clarifies misconceptions about negative bases in exponential functions, explaining that the negative sign in front of the base does not raise the base to a power but rather affects the output. It demonstrates how to correctly interpret and graph functions with negative coefficients, such as -3^x + 1, by focusing on the order of operations and the impact on the graph's reflection and vertical shift.
📉 Graphing with Fractional Bases and Vertical Stretches
The discussion moves to graphing exponential functions with fractional bases, such as (1/2)^x, and how they result in a decreasing graph due to the base being less than one. The paragraph explains the process of identifying key points, vertical stretches, and how to adjust these points according to transformations. It emphasizes that the graph's behavior must adhere to the horizontal asymptote and the nature of the base.
🔢 Graphing Exponentials with Base e and Transformations
The video script addresses graphing exponential functions with the base e, which is approximately 2.7. It outlines how to identify key points and transformations, including vertical and horizontal shifts, and reflections for functions like e^(x+2-1). The presenter guides on plotting the graph by adjusting for the shifts and using the horizontal asymptote as a reference, providing an approximation for points involving the base e.
🎯 Advanced Graphing Techniques for Complex Exponentials
The final paragraph tackles the graphing of more complex exponential functions, emphasizing the importance of ordering the function correctly and identifying the base and exponent. It discusses how to handle multiple transformations, such as vertical shifts, horizontal shifts, reflections, and vertical stretches. The paragraph provides a comprehensive approach to plotting these complex graphs by using key points, considering the effects of negative signs on inputs and outputs, and ensuring the graph adheres to its asymptotic behavior.
➡️ Wrapping Up and Transitioning to Exponential Solutions
The video concludes with a summary of the techniques taught for graphing exponential functions with various transformations. It reassures viewers that the methods provided are robust and applicable to a wide range of exponential graphing scenarios. The presenter expresses hope that the content is clear and makes sense, and hints at upcoming topics, which include solving exponentials and transitioning to the graphs of logarithms.
Mindmap
Keywords
💡Exponential Functions
💡Graphing
💡Transformations
💡Horizontal Asymptote
💡Key Points
💡Vertical Shift
💡Horizontal Shift
💡Reflection
💡Vertical Stretch/Compression
💡Order of Operations
💡Euler's Number (e)
Highlights
The video focuses on graphing exponential functions with various transformations.
Key points for exponential functions are always (0,1) and (1, base), where 'base' is the base of the exponential.
A horizontal asymptote at y=0 is a common feature in the graphs of exponential functions.
The base of the exponential function, when greater than 1, results in an always increasing function.
If the base is less than 1, the function is decreasing; if it equals 1, the graph is a horizontal line, which is not typical for exponentials.
Transformations such as shifting left/right, up/down, and reflecting across the axes apply to exponential functions.
The process of graphing involves identifying the base, key points, and any transformations like shifts or reflections.
For the function 3^(x-2), the graph is shifted down by 2 units from the basic exponential graph of 3^x.
The presence of a negative sign in front of the exponential function indicates a reflection across the x-axis.
A vertical stretch or compression can be identified if there's a multiplier in front of the exponential part.
When graphing f(x) = 2^(x+2), there's a horizontal shift to the left by 2 units and the base is 2, indicating an increasing function.
For exponential functions with a base of e (approximately 2.7), the graphing process is similar to those with integer bases.
The video demonstrates how to handle complex exponential functions with multiple transformations, such as f(x) = e^(x+2) - 1.
The importance of order of operations is emphasized, especially when dealing with negative bases or coefficients.
The video concludes with a comprehensive example that includes a vertical shift, horizontal shift, reflection across both axes, and a vertical stretch.
The presenter suggests using a calculator for more precise points on the graph, especially when dealing with irrational numbers like e.
The technique demonstrated is applicable for graphing a wide range of exponential functions, including those with the Euler number e.
The video emphasizes the importance of understanding transformations and how they affect the graph of exponential functions.
Transcripts
Browse More Related Video
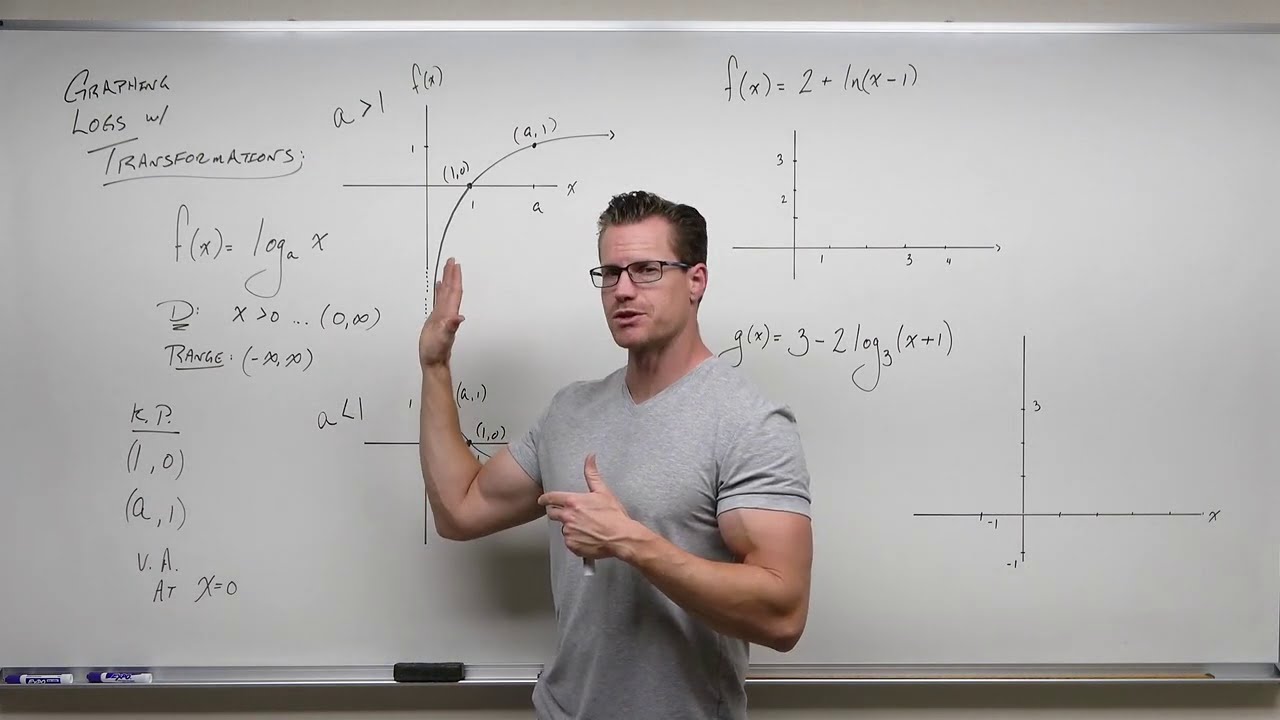
Graphing Logarithms with Transformations (Precalculus - College Algebra 56)
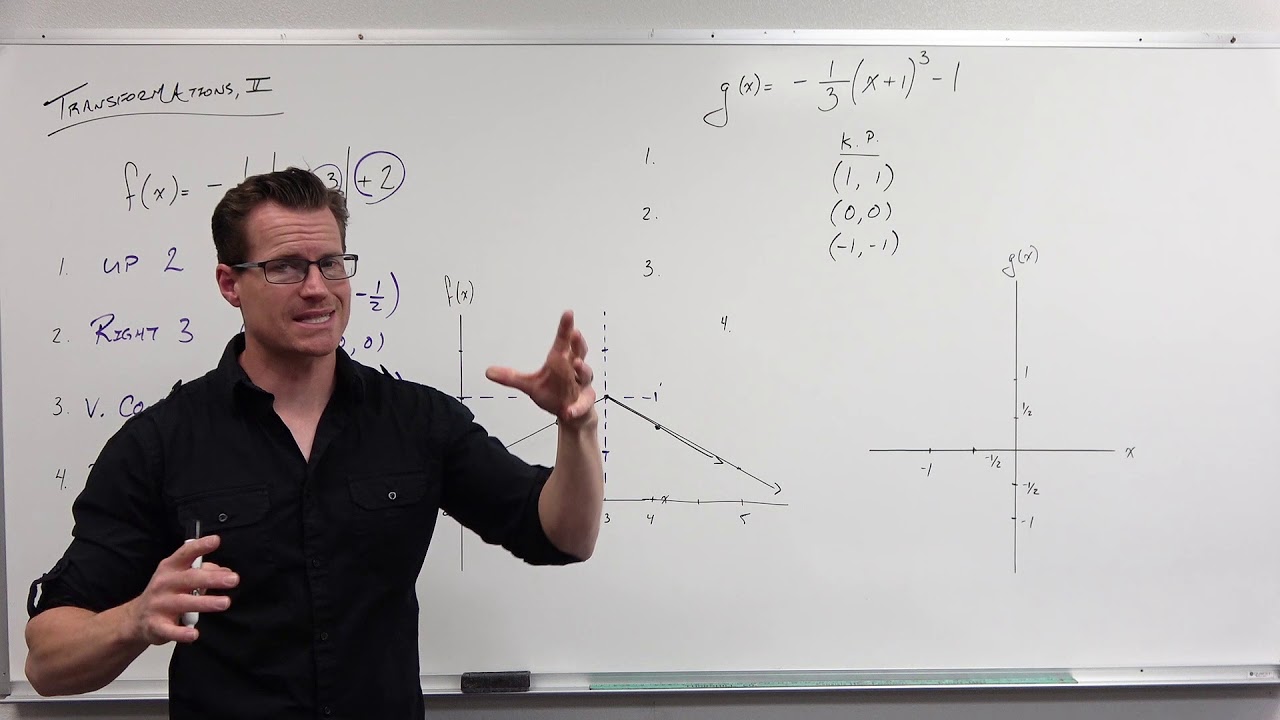
How to Graph with Transformations (Precalculus - College Algebra 15)
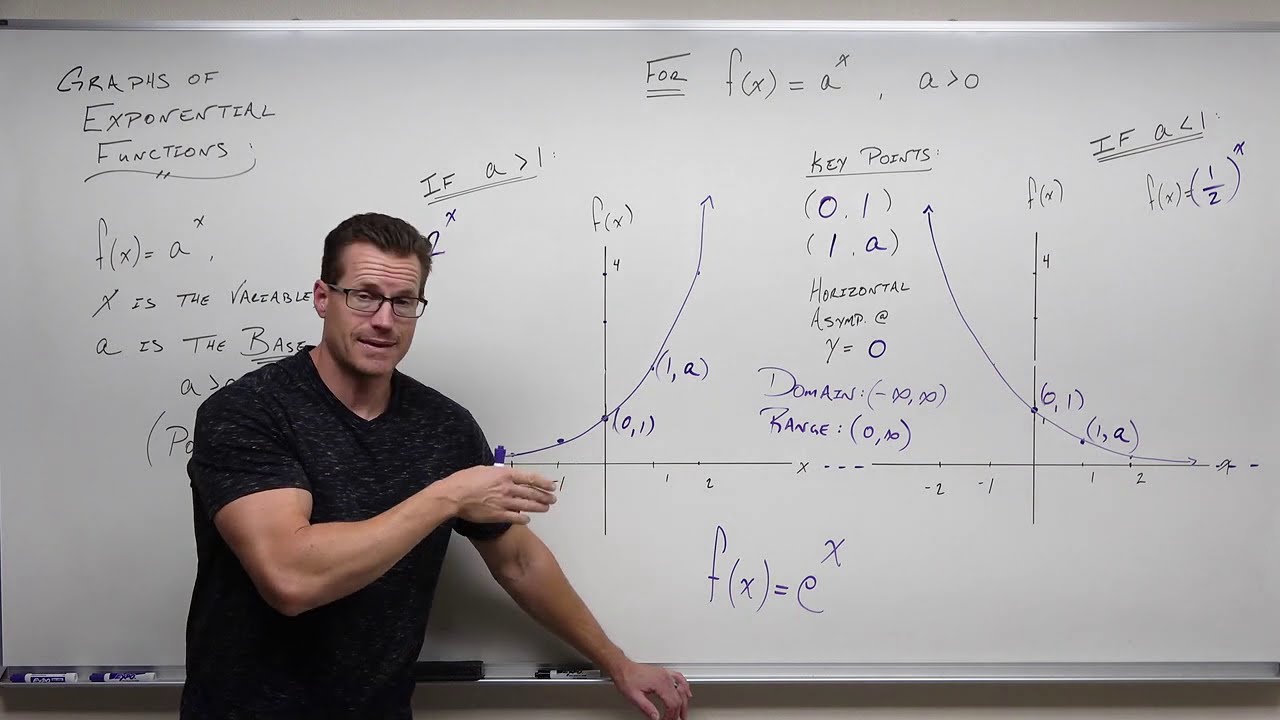
Graphs of Exponential Functions (Precalculus - College Algebra 52)

Ch. 4.1 Exponential Functions
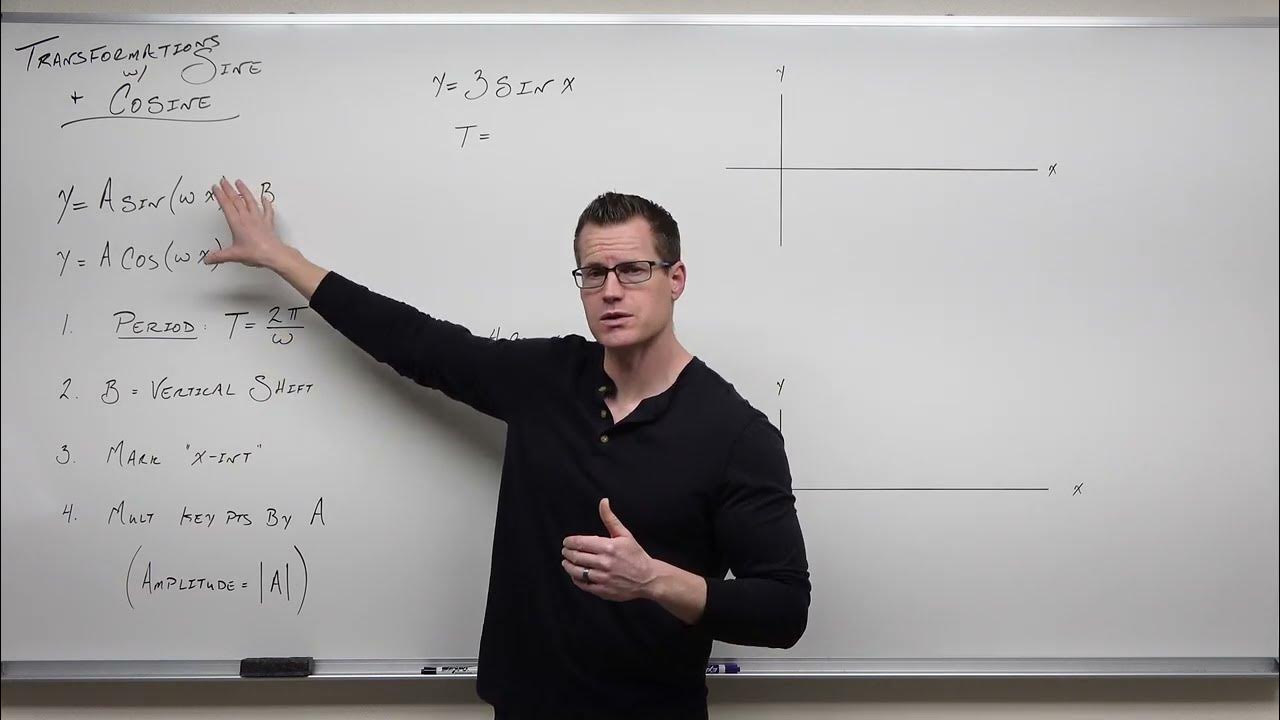
Graphing Transformations with Sine and Cosine (Precalculus - Trigonometry 12)
Parent Functions
5.0 / 5 (0 votes)
Thanks for rating: