How to calculate a regression equation, R Square, Using Excel Statistics
TLDRIn this educational podcast, the host explains how to calculate the R-squared value, a statistical measure of how well a regression model fits a dataset. The process involves calculating the sum of squares due to error (SSE), total sum of squares (SST), and sum of squares of regression (SSR). The host demonstrates these calculations using a spreadsheet, showing how to find the predictive values, calculate the error, and sum up the squared values for each. The final step is to divide SSR by SST to obtain the R-squared value, which in the example is 0.92, indicating a strong model fit.
Takeaways
- 📊 The podcast discusses how to calculate R-squared, a statistical measure of how well a regression model fits a dataset.
- 🔢 The first step in calculating R-squared is to determine the sum of squares due to error, which is the squared difference between individual observations and predicted values.
- 📈 The actual values are located in column C, and the predicted values are in column H, with the difference (error) and its square calculated accordingly.
- 🧮 The total sum of squares (SST) is calculated by taking the actual values, subtracting the mean, and squaring the result.
- 📋 The sum of squares for regression (SSR) is found by subtracting the mean of Y from the predicted values and squaring the result.
- 📝 The spreadsheet is used to demonstrate the calculations, with specific cells and formulas highlighted for clarity.
- 🔗 The predicted value formula involves the y-intercept and the slope (B1 * X), with the example showing B1 as 12 and X as 2.
- 📉 The error is calculated by taking the difference between the actual Y score and the predicted value, and then squaring it.
- 📊 To find the sum of the squared errors, the podcast suggests highlighting and summing the relevant columns in the spreadsheet.
- 📐 SST is calculated by taking each Y value, subtracting the mean of Y, squaring the result, and summing these values.
- 🔑 The final step is to calculate R-squared by dividing SSR by SST, which in the example provided results in an R-squared of 0.92, indicating a high fit of the model to the data.
Q & A
What is the main topic of the podcast?
-The main topic of the podcast is how to calculate the R-squared value in statistics.
What is the first step in calculating R-squared according to the podcast?
-The first step is to calculate the sum of squares due to error, which is the squared difference between individual observations and predicted observations.
How is the error calculated in the context of the podcast?
-The error is calculated by taking the difference between the actual value and the predicted value.
What does SST represent in the podcast?
-SST stands for the total sum of squares, which is calculated by taking the actual value minus the mean, and then squaring the result.
What is the formula for calculating SS R (sum of squares regression) according to the transcript?
-SS R is calculated by taking the predicted value, subtracting the mean of Y, and then squaring the result.
How does the podcast describe the process of calculating the predicted value?
-The predicted value is calculated using the equation where the y-intercept plus the slope (multiplied by the value of X) gives the predicted value.
What is the purpose of using the sum function in the spreadsheet as described in the podcast?
-The sum function is used to aggregate the squared errors and other squared values to calculate SS E (sum of squares error), SST, and SS R.
How is the error squared in the podcast's explanation?
-The error is squared by taking the difference between the actual and predicted values, and then squaring that difference.
What is the final formula to calculate R-squared as mentioned in the podcast?
-The final formula to calculate R-squared is SS R divided by SST.
What value of R-squared is mentioned in the podcast?
-The podcast mentions an R-squared value of 0.92.
Why is it important to fix certain cells when dragging down formulas in the spreadsheet as described in the podcast?
-Fixing certain cells ensures that the formula references specific cells correctly and does not change as the formula is copied down, maintaining the accuracy of the calculations.
Outlines
📊 Calculating R-Squared and Error Sum of Squares
This paragraph explains the process of calculating the R-squared value in a regression analysis. The speaker begins by introducing the concept and then demonstrates how to calculate the sum of squares due to error (SSE), which involves taking the difference between individual observations and predicted values, squaring them, and summing the results. The total sum of squares (SST) is also discussed, which is the sum of the squared differences between the actual values and the mean. The speaker uses a spreadsheet to illustrate these calculations, showing how to find the predicted values, calculate the error, and sum these values to obtain SSE. The process of calculating the sum of squares for regression (SSR) is also shown, which involves subtracting the mean of Y from the predicted values, squaring the result, and summing these values. The R-squared value is then derived from the ratio of SSR to SST, indicating the proportion of the variance in the dependent variable that is predictable from the independent variable(s).
🔢 Spreadsheet Demonstration of R-Squared Calculation
In this paragraph, the speaker continues the explanation of calculating R-squared by providing a step-by-step demonstration using a spreadsheet. The focus is on the practical application of the formulas discussed in the previous paragraph. The speaker shows how to calculate the predicted values using a regression equation, highlighting the importance of using the correct cell references and ensuring that the coefficients are fixed with dollar signs to avoid errors when copying the formula down the column. The error is calculated by finding the difference between the actual and predicted values, squaring it, and summing these squared errors to get SSE. The total sum of squares (SST) is calculated by subtracting the mean from each actual value, squaring the result, and summing these values. The sum of squares for regression (SSR) is similarly calculated by subtracting the mean from the predicted values and squaring the result. The final step is to compute the R-squared value by dividing SSR by SST, which in the example provided results in an R-squared of 0.92, indicating a high proportion of variance explained by the model.
Mindmap
Keywords
💡R-squared
💡Summer Squares Due to Error
💡Observation
💡Predictive Value
💡Actual Value
💡Total Sum of Squares (SST)
💡Regression Sum of Squares (SSR)
💡Spreadsheet
💡Mean
💡Error
💡Coefficient
Highlights
Introduction to calculating R-squared in a podcast.
Explanation of calculating the sum of squares due to error.
Demonstration of using a spreadsheet to calculate errors and sums.
Identification of actual and predictive values in the spreadsheet.
Process of calculating the total sum of squares (SST).
Description of the formula for calculating SST with the mean.
Introduction of the sum of squares for regression (SSR).
Calculation of SSR using the predicted value and the mean.
Explanation of the relationship between SSR, SST, and R-squared.
Guidance on using the spreadsheet to input predictive equations.
Method for calculating the predicted value using coefficients.
Illustration of calculating the error and its sum.
Technique for squaring the error and summing for SSE.
Calculation of SST by subtracting the mean from Y values.
Instructions on fixing cell references for consistent calculations.
Process of calculating SS R using the predicted value and the mean.
Final calculation of R-squared using SS R and SST.
Result of R-squared calculation showing a value of 0.92.
Transcripts
Browse More Related Video
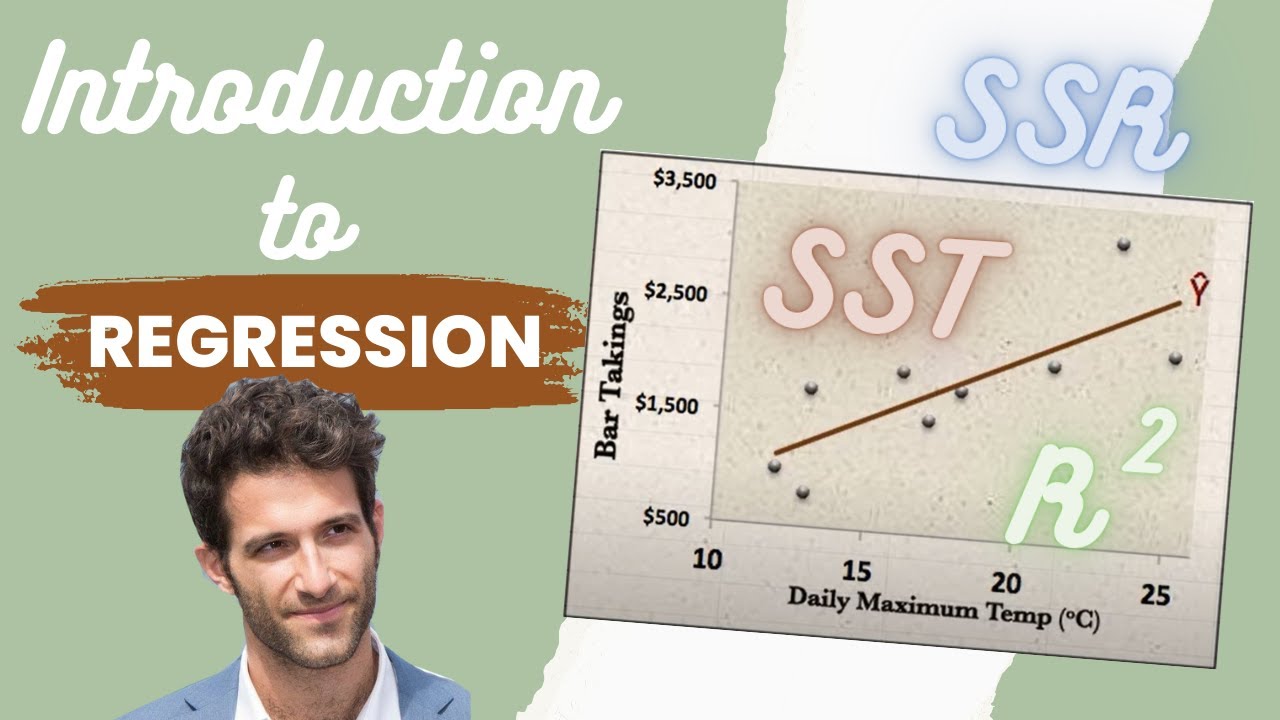
Introduction to REGRESSION! | SSE, SSR, SST | R-squared | Errors (ε vs. e)
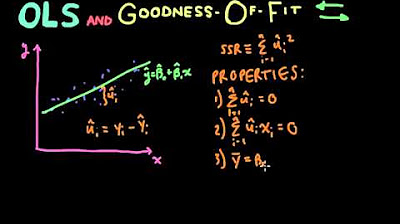
Econometrics // Lecture 3: OLS and Goodness-Of-Fit (R-Squared)
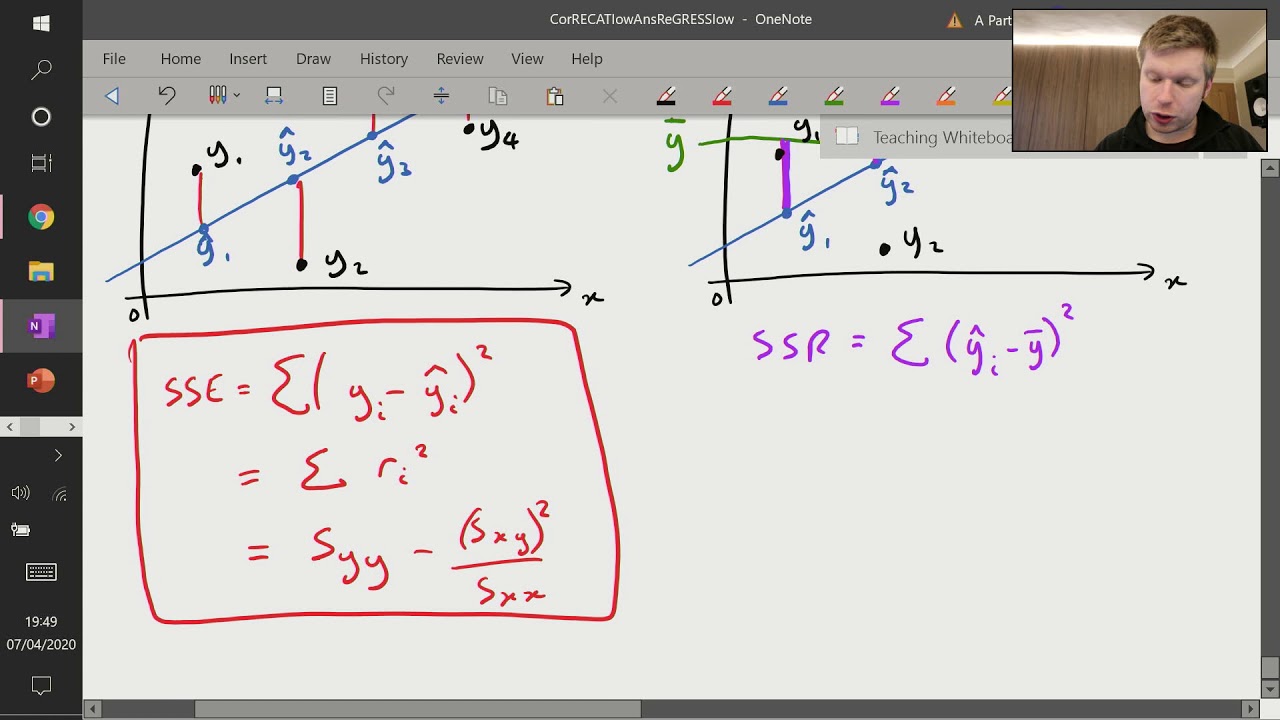
Correlation and Regression (6 of 9: Sum of Squares - SSE, SSR and SST)

R Squared Explained in 5 minutes
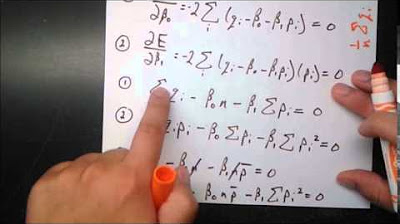
Ordinary Least Squares Regression

How to Calculate R Squared Using Regression Analysis
5.0 / 5 (0 votes)
Thanks for rating: