GEPHI - Introduction to Network Analysis and Visualization (Tutorial)
TLDRThis video tutorial introduces network analysis using Gephi, an open-source software for network visualization. It guides users through the process of analyzing two different data sets to create unique network visualizations. The tutorial covers importing data, applying various layout algorithms like Fruchterman Reingold and Force Atlas 2, and using plugins for additional functionality. It also explains how to interpret the visualizations by calculating and applying attributes such as degree, weighted degree, and betweenness centrality. The video concludes with tips on exporting and saving projects for further analysis.
Takeaways
- 🌐 Gephi is a powerful open-source software for network visualization and analysis.
- 🔄 The video tutorial covers two datasets to demonstrate different types of network analysis.
- 🔍 The tutorial is based on an older version of Gephi, but it remains valid despite updates to the software.
- 📂 The video provides a link to the datasets and the complete process in the description.
- 🔌 The 'Geolayout' and 'Noverlap' plugins are introduced for advanced network visualization.
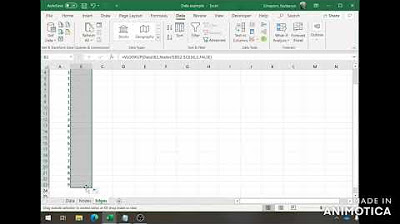
- 📊 Importing and processing data involves using the Data Laboratory and specifying data types and delimiters.
- 🎨 Nodes can be sized and colored based on their degree or weighted degree for visual emphasis.
- 🔍 Different layout algorithms like Fruchterman Reingold and Force Atlas 2 are used to organize and visualize networks.
- 📐 The 'Statistics' panel is crucial for adding attributes and exploring the network's characteristics.
- 🌍 The Geolayout plugin is used to display nodes on a geographical map with a specific scale and projection.
- 🔄 Transforming two-mode networks into one-mode networks allows for new insights and visualizations.
- 💾 Saving the project and exporting visualizations in formats like SVG is essential for future revisions and presentations.
Q & A
What is the main focus of this video introduction?
-The main focus of this video introduction is to provide a tutorial on network analysis using Gephi, an open-source software for network visualization.
What are the two types of networks covered in this tutorial?
-The two types of networks covered in this tutorial are one-mode and two-mode networks.
What is the purpose of the 'Geolayout' plugin mentioned in the tutorial?
-The 'Geolayout' plugin is used to display nodes in a geographical way, allowing the visualization of networks on a map with latitude and longitude coordinates.
How does the 'Force Atlas 2' layout algorithm function?
-The 'Force Atlas 2' layout algorithm disperses groups and gives space around larger nodes, preventing node overlapping. It uses a force-directed approach to create a visually readable network layout.
What is 'modularity' in network analysis, and how is it used?
-Modularity is a measure used to highlight communities within a graph. It helps to identify groups of nodes that are more densely connected with each other than with the rest of the network.
What is 'betweenness centrality' and its significance in network analysis?
-Betweenness centrality measures the number of times a node lies on the shortest path between every pair of nodes in the network. It is significant for identifying nodes that occupy an intermediate or bridge position between other nodes or groups.
The 'multimode network transformation' plugin allows the conversion of a two-mode network into a one-mode network by projecting the connections between different categories of nodes onto a single category.
-The plugin transforms a two-mode network into a one-mode network by creating direct edges between nodes that share a connection to the same institution or entity.
What is the recommended file format for exporting high-quality network visualizations?
-The recommended file format for exporting high-quality network visualizations is SVG (Scalable Vector Graphics), as it is modifiable by image or drawing software and maintains resolution quality.
How can you adjust the appearance of the network visualization?
-The appearance of the network visualization can be adjusted using the Preview panel, where settings like edge opacity and node color can be fine-tuned without affecting the graph's structure.
What is the significance of saving the Gephi project file?
-Saving the Gephi project file allows you to return to the project and make changes or further analysis at a later time, ensuring that your work is preserved and can be continued.
How can you identify and analyze specific nodes and their connections?
-You can identify and analyze specific nodes and their connections by using the paint bucket tool in the Preview panel to paint the 'neighbors of neighbors' and 'neighbors' of the node of interest, and then exporting these results.
Outlines
📊 Introduction to Network Analysis with Gephi
This paragraph introduces the video tutorial on network analysis using Gephi, an open-source software renowned for its visualization capabilities. The tutorial is based on two datasets to demonstrate the creation of different types of networks. It mentions that the tutorial is voiced over an existing one and that Gephi has been updated since, but the interface remains the same, validating the tutorial's relevance. The speaker encourages viewers to watch in high definition and use subtitles for clarity, and provides a link to the complete process in the video description.
🔍 Importing Data and Initial Setup
The speaker guides the audience through the initial steps of using Gephi, including importing a 'Geolayout' plugin for geographical mapping and a 'Noverlap' plugin for preventing node overlap. The process of importing datasets (nodes1.csv and edges1.csv) is detailed, emphasizing the need to specify data types and delimiters. The overview panel is introduced as the central place for graph visualization, where nodes are initially spatialized randomly. The speaker then explains how to adjust node size based on their degree (number of connections) and proceed with the Fruchterman Reingold algorithm for better visualization, highlighting communities within the network.
🎨 Visualizing and Analyzing the Network
This section delves into the visualization and analysis of the network. The speaker discusses the importance of the 'average weighted degree' and how it differs from simple degree count. The tutorial then covers coloring nodes based on 'weighted in-degree' to represent the number of incoming edges. Additional details like adding node labels and fine-tuning the visualization using the 'Preview' panel are provided. The speaker also touches on the importance of further analysis using statistical measures like modularity, betweenness centrality, and network diameter to gain deeper insights into the network's structure and dynamics.
🌍 Geospatial Mapping and Two-mode Network Analysis
The speaker explains how to use the Geolayout plugin to display nodes on a geographical map, adjusting for latitude and longitude, and using the Noverlap plugin to prevent overlapping. The tutorial then transitions to analyzing a two-mode network, where different entities (e.g., companies and people) are represented. The process of transforming a two-mode network into a one-mode network using the 'multimode network transformation' plugin is outlined, including setting up the transformation and cleaning the graph. The speaker also discusses the impact of projection on network density and the importance of analyzing the new connections formed. Finally, the tutorial covers exporting the network visualization and saving the Gephi project for future reference.
Mindmap
Keywords
💡Gephi
💡Network Analysis
💡Visualization
💡Plugins
💡Nodes
💡Edges
💡Layout Algorithms
💡Centrality Measures
💡Communities
💡Two-mode Network
💡Projection
Highlights
Introduction to network analysis with Gephi, an open-source software renowned for its network visualization capabilities.
The tutorial is based on two data sets to produce two different types of networks, with resources provided on the described page.
Gephi's interface remains consistent despite software updates, ensuring the tutorial's ongoing relevance.
A one-mode network example is demonstrated, showcasing the import and use of the Geolayout plugin for geographical visualization.
The use of the Force Atlas 2 layout algorithm is explained for dispersing groups and providing space around larger nodes.
The importance of the statistics section for adding more information to the graph and influencing node attributes is emphasized.
The tutorial details how to calculate the 'average weighted degree' to add more attributes to the graph.
The process of coloring nodes based on the 'weighted in degree' to indicate the number of incoming edges is described.
Adding labels to nodes for better readability and understanding of the data is discussed.
The 'Preview' panel is introduced for fine-tuning the visualization and exporting the network map in high-quality formats like SVG.
Exploration of the 'modularity' calculation to highlight communities within the graph is explained.
The 'betweenness centrality' metric is introduced to detect nodes that occupy intermediate positions in the network.
The use of the Geolayout plugin with a geographical background is demonstrated for geographical network mapping.
The tutorial transitions to a two-mode network, explaining the process of installing the 'multimode network transformation' plugin.
A clear demonstration of how to transform a two-mode network into a one-mode network using the multimode network projection plugin.
The significance of the network diameter calculation and its application in coloring nodes based on 'betweenness centrality' is highlighted.
Final steps include exporting and saving the Gephi project for future revisions and analysis.
Transcripts


5.0 / 5 (0 votes)
Thanks for rating: