Central limit theorem | Inferential statistics | Probability and Statistics | Khan Academy
TLDRThe central limit theorem is a fundamental concept in statistics and mathematics, highlighting the remarkable tendency of sample means to approximate a normal distribution regardless of the original distribution's shape. As the sample size increases, this approximation becomes more precise, which is particularly useful for analyzing various real-life processes, leading to the prevalence of the normal distribution in statistical analysis.
Takeaways
- 📊 The central limit theorem is a fundamental concept in statistics and mathematics.
- 🎲 It applies to any distribution with a well-defined mean and variance, whether continuous or discrete.
- 🔢 The theorem demonstrates the power of averaging multiple samples from a non-normal distribution.
- 🎯 As sample sizes increase, the distribution of sample means approaches a normal distribution.
- 🔍 The video uses a discrete probability distribution with values from 1 to 6 to illustrate the theorem.
- 📈 The mean and standard deviation of the original distribution influence the shape of the sample mean distribution.
- 🧩 By taking multiple samples and averaging them, the resulting distribution's mean is the average of the means.
- 📊 With a sample size of 4, the distribution of sample means shows a range of outcomes, but still approaches normality.
- 🔼 Increasing the sample size to 20 or more significantly improves the approximation to a normal distribution.
- 🌐 The central limit theorem is useful for understanding the behavior of sums or averages of random variables in various processes.
- 🔄 The process of repeatedly sampling and averaging leads to a frequency distribution that increasingly resembles a normal distribution.
- 🎓 The normal distribution's prevalence in statistical analysis is due to the central limit theorem's implications.
Q & A
What is the central limit theorem?
-The central limit theorem is a fundamental concept in statistics and mathematics which states that the distribution of sample means, when sampled from any population with a well-defined mean and variance, will approach a normal distribution as the sample size becomes larger, regardless of the original population's distribution.
What are the prerequisites for a distribution to be applicable to the central limit theorem?
-For a distribution to be applicable to the central limit theorem, it must have a well-defined mean and variance. It could be either a continuous or a discrete distribution.
What does it mean for a distribution to have a well-defined variance?
-A distribution has a well-defined variance if it has a standard deviation that can be calculated. This implies that the mean and variance of the distribution are identifiable and finite values.
How does the central limit theorem demonstrate the power of statistics?
-The central limit theorem demonstrates the power of statistics by showing that even if the original distribution is not normal, the distribution of sample means will approximate a normal distribution as the sample size increases. This allows statisticians to make inferences and predictions with a high degree of confidence, as the normal distribution is well-understood and has many desirable properties.
What is the significance of the sample size in the central limit theorem?
-The sample size is significant in the central limit theorem because as the sample size increases, the distribution of the sample means becomes a closer approximation to the normal distribution. Even with a small sample size, the approximation can be quite good, but with larger sample sizes, the approximation becomes nearly perfect.
What happens to the standard deviation of the sample means as the sample size increases according to the central limit theorem?
-As the sample size increases, the standard deviation of the sample means decreases. This means that the sample means become more concentrated around the true mean of the population, leading to a tighter distribution around the mean.
What is the role of the mean in the central limit theorem?
-The mean plays a crucial role in the central limit theorem as it is the average value that is being calculated from the samples. The theorem states that the distribution of these sample means will approach a normal distribution with a mean that is equal to the population mean as the sample size increases.
Can the central limit theorem be applied to the sample sum?
-Yes, the central limit theorem can also be applied to the sample sum. If you take the sum of the values from a sample of a distribution and repeat this process many times, the distribution of these sample sums will also approach a normal distribution as the sample size increases.
Why is the normal distribution so prevalent in statistics?
-The normal distribution is prevalent in statistics because of the central limit theorem. Many processes in nature and society, when aggregated, follow a normal distribution due to the averaging effect described by the central limit theorem. This makes the normal distribution a powerful tool for modeling and making inferences about various phenomena.
How does the central limit theorem relate to everyday life processes?
-The central limit theorem relates to everyday life processes by providing a statistical framework for understanding and predicting the outcomes of many independent actions or events. For instance, it can be used to model the aggregate behavior of people in a market, the outcomes of numerous trials in an experiment, or the distribution of measurements from a complex system.
What would happen if we were to sample an infinite number of times according to the central limit theorem?
-If we were to sample an infinite number of times according to the central limit theorem, the distribution of the sample means would become a perfect normal distribution, with the mean equal to the population mean and the standard deviation approaching zero as the sample size increases without bound.
How does the central limit theorem help in making statistical inferences?
-The central limit theorem helps in making statistical inferences by allowing us to use the properties of the normal distribution to make predictions and draw conclusions about the population from sample data. Since the sample means will be normally distributed when the sample size is large enough, we can apply the vast array of statistical tests and procedures that are based on the normal distribution to make inferences about the population parameters.
Outlines
📊 Introduction to the Central Limit Theorem
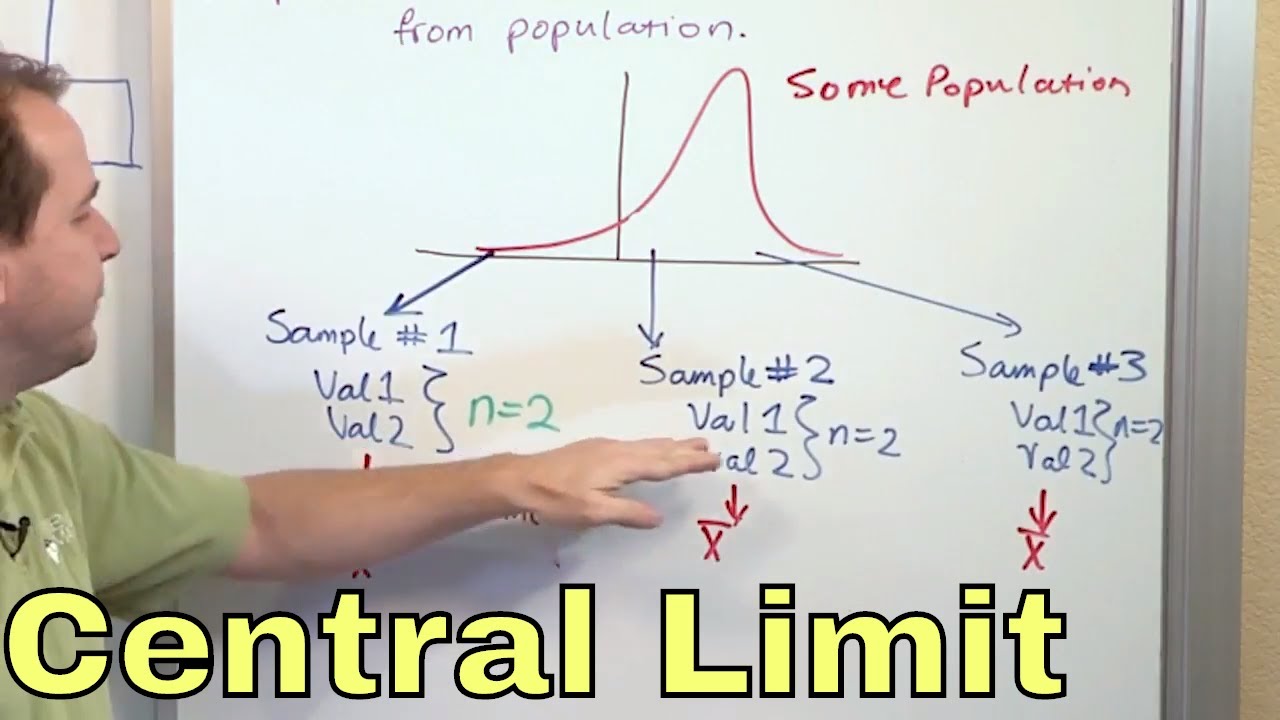
This paragraph introduces the central limit theorem, a fundamental concept in statistics and mathematics. It explains that the theorem applies to any distribution with a well-defined mean and variance, whether continuous or discrete. The speaker illustrates the concept using a discrete probability distribution function that does not resemble a normal distribution, resembling a 'crazy dice' with certain outcomes being more likely than others. The speaker then describes the process of taking samples from this distribution, calculating their means, and observing how these sample means distribute when taken in larger numbers.
📈 Frequency Distribution of Sample Means
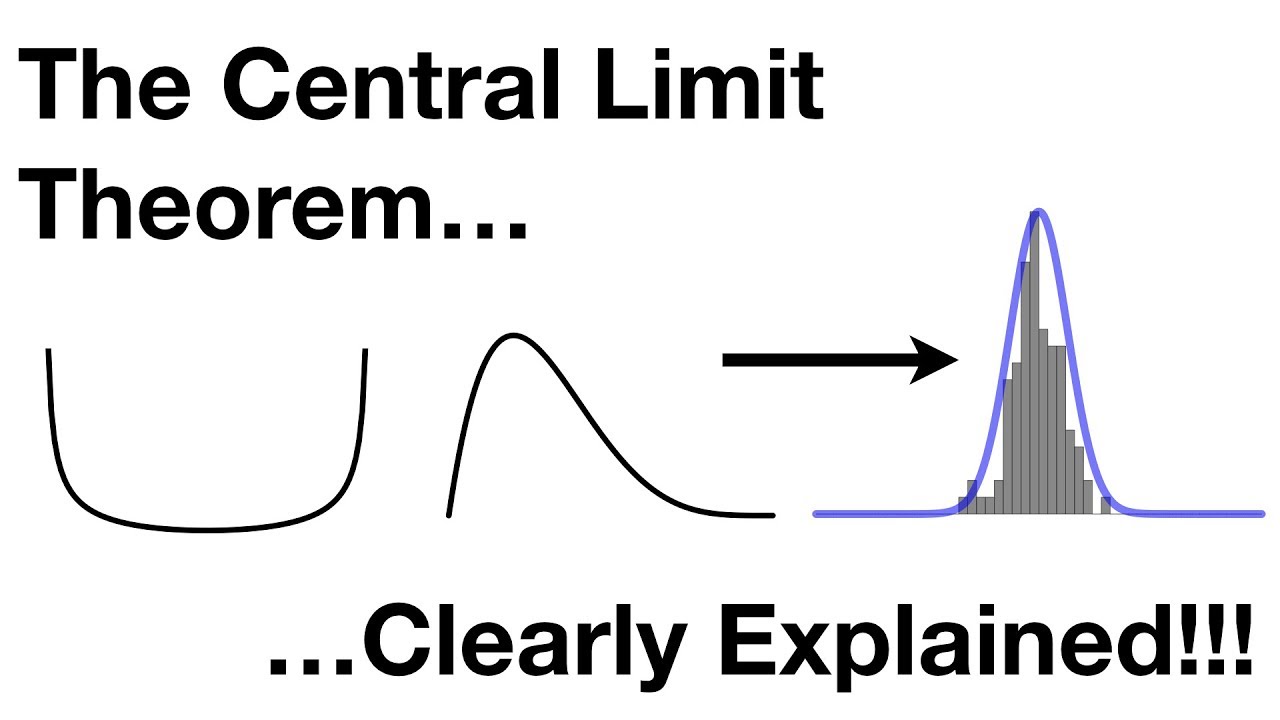
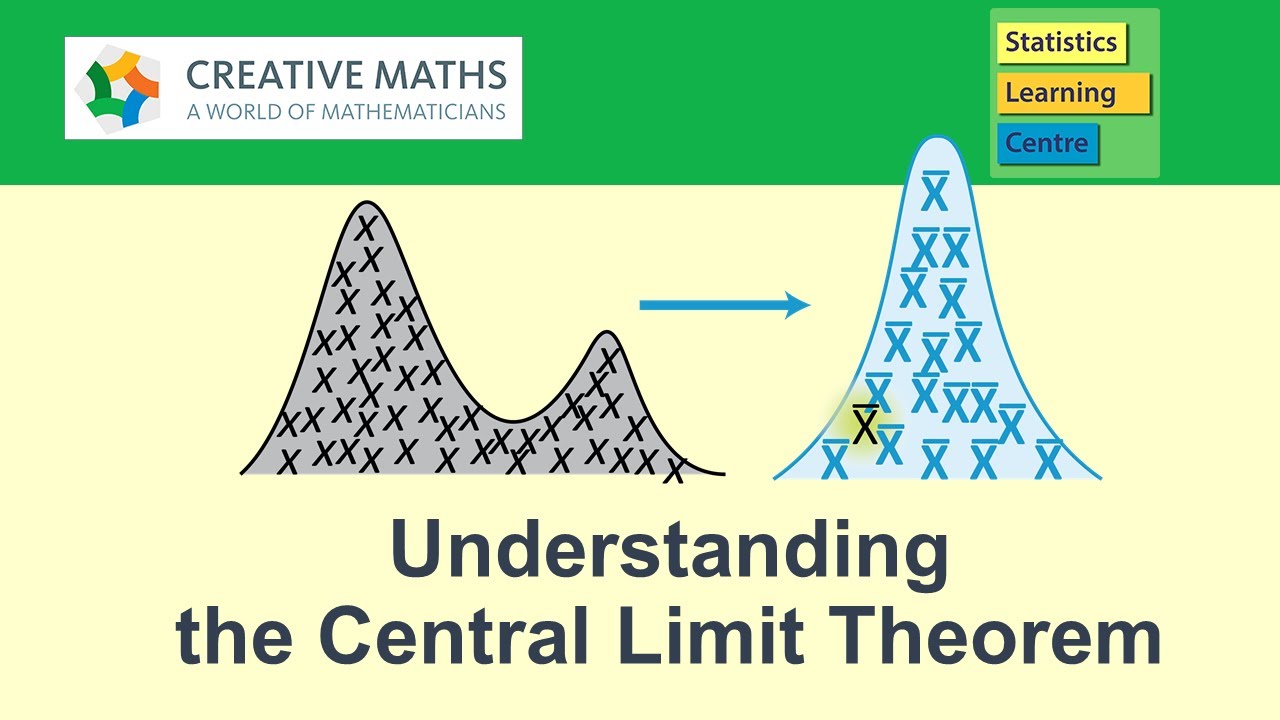
In this paragraph, the speaker continues the discussion on the central limit theorem by explaining how the frequency distribution of sample means tends to approximate a normal distribution as the sample size increases. The speaker provides a detailed example of how plotting the sample means from a distribution with a sample size of 4 results in a distribution that begins to resemble a normal shape, even though the original distribution was quite different. The speaker emphasizes that this approximation becomes more accurate with larger sample sizes, and it also applies to sample sums, not just means. The central limit theorem is highlighted as a powerful tool in understanding the behavior of sums or averages of various processes, which is why the normal distribution is widely used in statistical analysis.
Mindmap
Keywords
💡Central Limit Theorem
💡Probability Distribution
💡Sample Size
💡Mean
💡Standard Deviation
💡Frequency Distribution
💡Sample
💡Normal Distribution
💡Variance
💡Discrete Distribution
💡Sample Mean
Highlights
The central limit theorem is introduced as one of the most fundamental and profound concepts in statistics and mathematics.
The theorem applies to any distribution with a well-defined mean and variance, including both continuous and discrete distributions.
The example used is a discrete probability distribution function that does not resemble a normal distribution.
The distribution has a high likelihood of getting a 1 and a very likely chance of getting a 6, with impossible outcomes for values 2 and 5.
The mean and standard deviation of the distribution are explained with respect to the given example.
The concept of sample size is introduced, with an initial focus on a sample size of n equals 4.
The process of taking samples, calculating the mean of those samples, and then averaging them is described.
The calculation of the sample mean is demonstrated with a specific example of four samples.
The concept of the sampling distribution of the sample mean is introduced.
The frequency distribution of the sample means is plotted to visualize the outcomes.
As more samples are taken and plotted, the distribution starts to approximate a normal distribution.
The central limit theorem's applicability is demonstrated by showing that even with a sample size of 4, a normal distribution can be approximated.
The impact of increasing the sample size, such as to n equals 20, is discussed in terms of how it improves the approximation to a normal distribution.
The central limit theorem is not only applicable to the sample mean but also to the sample sum.
The theorem's practical applications are highlighted, explaining why the normal distribution is prevalent in statistics and as an approximation for various processes.
The video promises to show empirical evidence of the central limit theorem in action in future content.
Transcripts
Browse More Related Video

Sampling distribution of the sample mean | Probability and Statistics | Khan Academy
7. Confidence Intervals
The Central Limit Theorem, Clearly Explained!!!
The Central Limit Theorem - understanding what it is and why it works
02 - What is the Central Limit Theorem in Statistics? - Part 1

The Normal Distribution: Crash Course Statistics #19
5.0 / 5 (0 votes)
Thanks for rating: