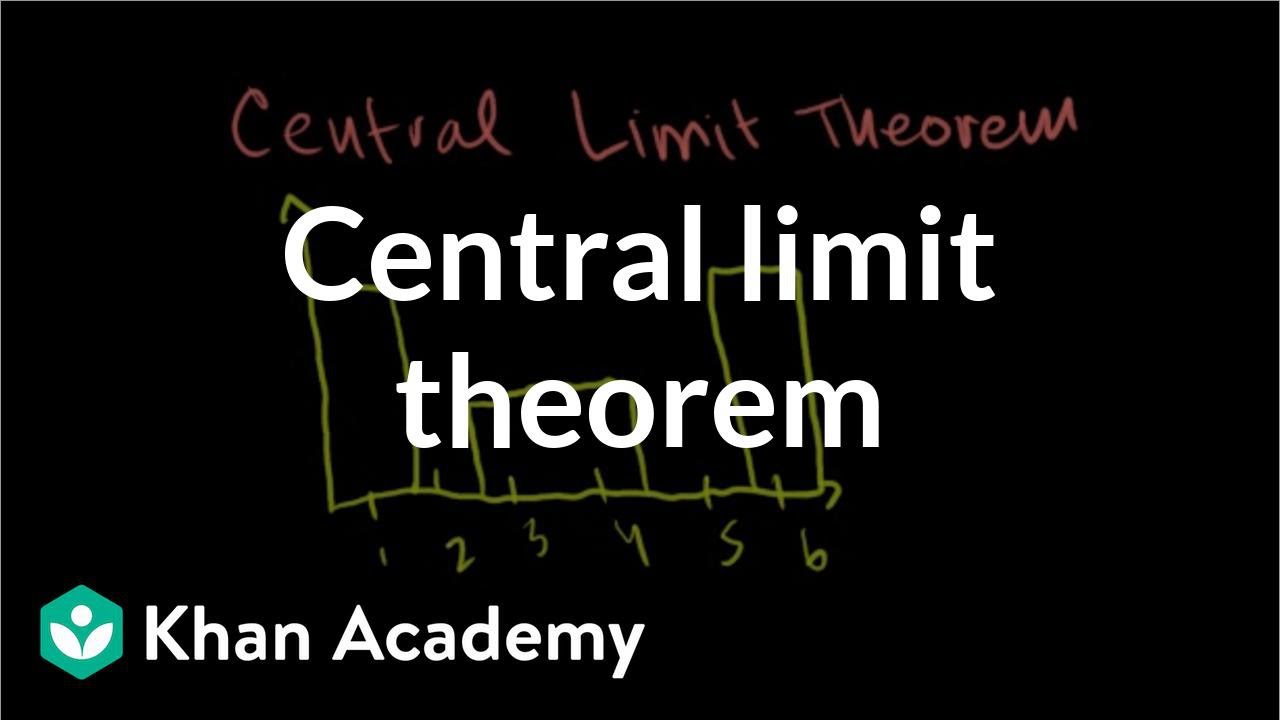
Sampling distribution of the sample mean | Probability and Statistics | Khan Academy
TLDRThe video script discusses the central limit theorem, a fundamental concept in statistics. It explains that regardless of the original distribution's shape, taking multiple samples and calculating their means will result in a distribution that approximates a normal distribution. This approximation improves as the sample size increases. The video uses an interactive app from onlinestatbook.com to visually demonstrate how a non-normal distribution's sample means become more normal with larger sample sizes, highlighting the theorem's applicability to various distributions.
Takeaways
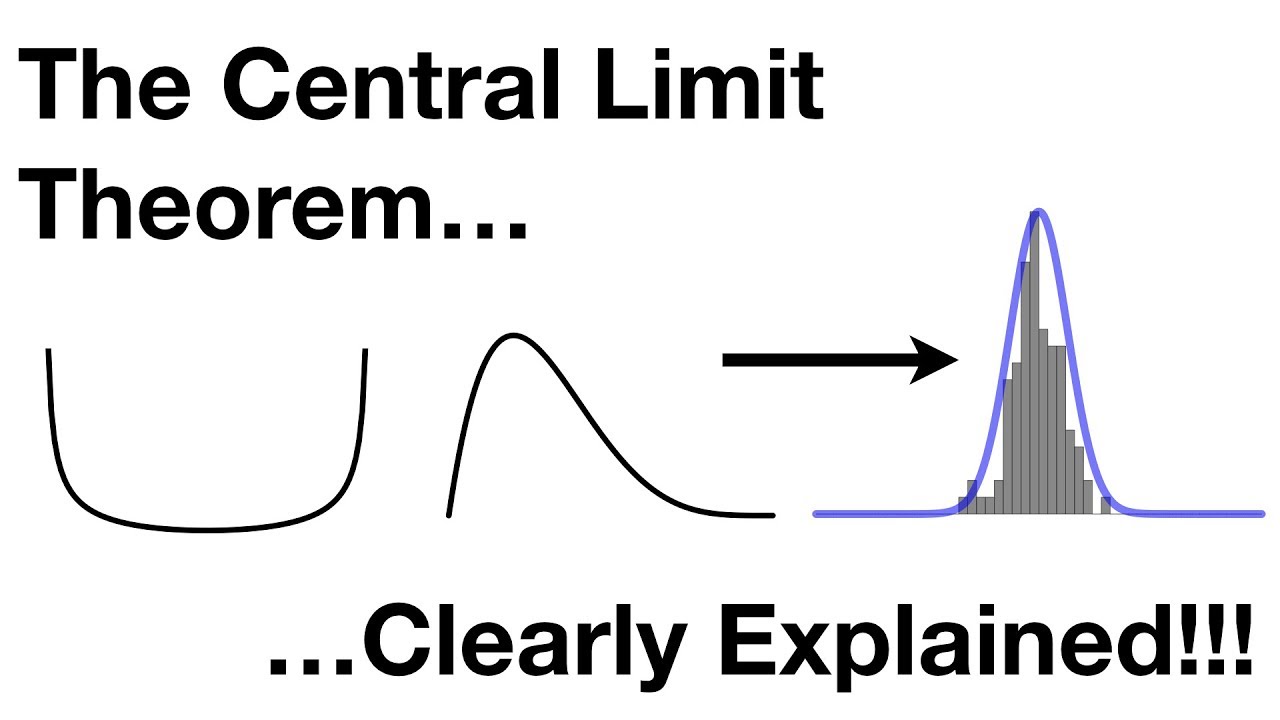
- 📊 The central limit theorem is a fundamental concept in statistics, stating that the distribution of sample means for a sufficiently large number of samples will be approximately normal, regardless of the original distribution.
- 🔢 A distribution must have a well-defined mean and standard deviation (or variance) to apply the central limit theorem, even if it's not initially normal.
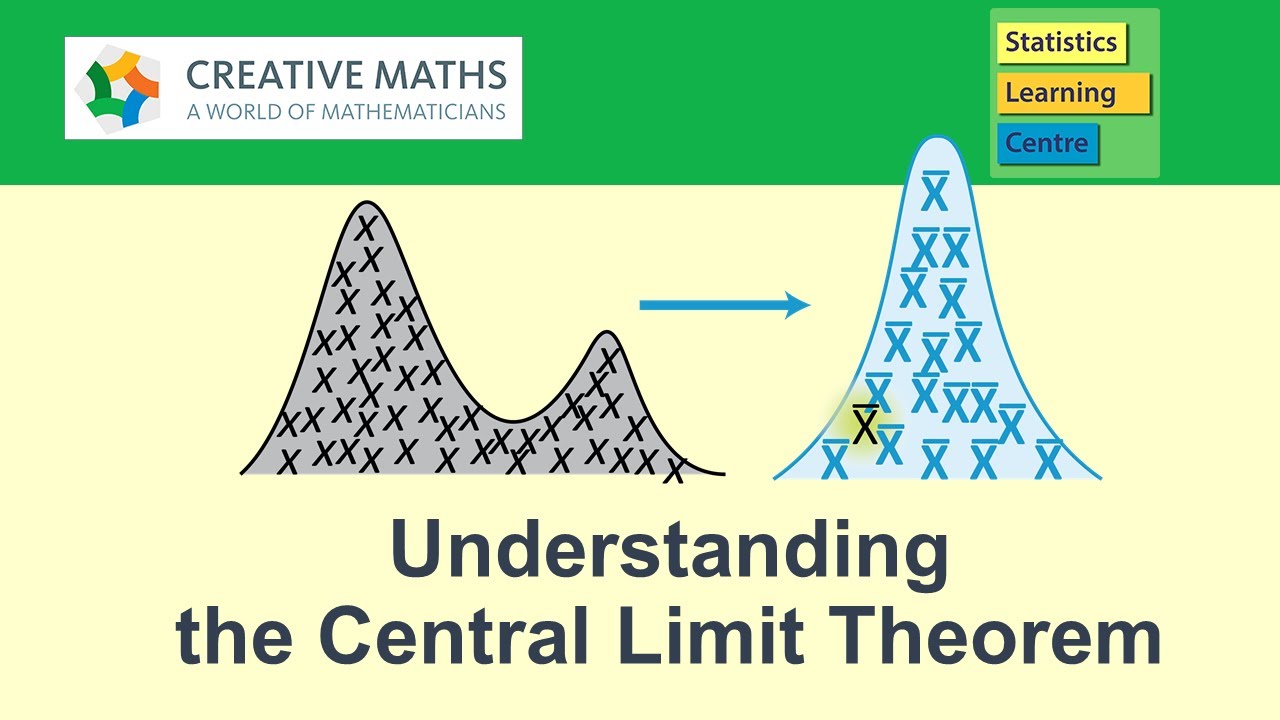
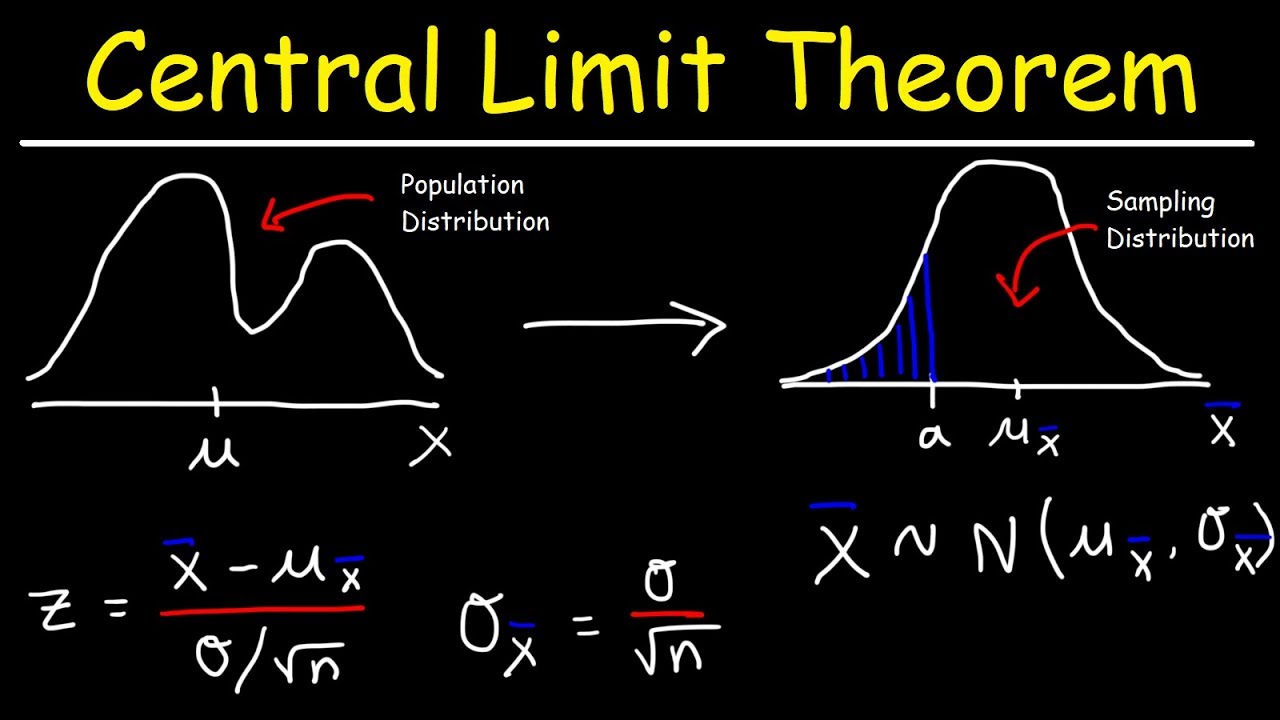
- 🔼 The sampling distribution of the sample mean is the distribution of all sample means obtained from a certain number of samples from a given population.
- 🌟 As the sample size (n) increases, the sampling distribution becomes a better approximation of the normal distribution.
- 📈 The mean of the sampling distribution will be equal to the mean of the original distribution, and the standard deviation of the sampling distribution will be the standard deviation of the original distribution divided by the square root of the sample size.
- 📊 Skewness and kurtosis are measures of the shape of a distribution; skewness indicates the asymmetry of the distribution around the mean, while kurtosis indicates the 'tailedness' and peakness.
- 🔄 The video demonstrates an experiment using an app from onlinestatbook.com to visually show how the central limit theorem works with a non-normal distribution.
- 🔢 With a larger sample size, the sampling distribution becomes more normal in shape and has a tighter fit around the mean, reducing the likelihood of样本 means being far from the original mean.
- 💡 The central limit theorem is not proven mathematically in the video, but the experimental evidence supports its validity for any distribution.
- 🧠 Understanding the central limit theorem is crucial for various statistical analyses, including hypothesis testing and confidence interval estimation.
- 🔍 The video encourages viewers to experiment with different distributions using the onlinestatbook.com applet to further understand and believe in the central limit theorem.
Q & A
What is the central limit theorem?
-The central limit theorem is a fundamental concept in statistics which states that given a sufficiently large sample size, the sampling distribution of the sample means will be approximately normally distributed, regardless of the shape of the original population distribution.
Why is the central limit theorem significant?
-The central limit theorem is significant because it allows us to make inferences about population parameters based on sample statistics, even when the population distribution is not normally distributed. It provides a theoretical foundation for many statistical tests and confidence intervals.
What should a distribution have to apply the central limit theorem?
-A distribution should have a well-defined mean and standard deviation (or variance) to apply the central limit theorem. The specific shape of the distribution is not a concern, as long as these parameters are present.
What is a sample mean?
-A sample mean is the average of a set of values taken from a larger population. It is used as an estimate for the true population mean and is one of the most common statistics used in statistical analysis.
What is the sampling distribution of the sample mean?
-The sampling distribution of the sample mean is the probability distribution of the sample means obtained from a large number of independent samples drawn from the same population. It is derived from the original distribution and is used to understand the variability of the sample means.
How does the central limit theorem relate to the shape of the original distribution?
-The central limit theorem states that the shape of the original distribution does not significantly affect the distribution of the sample means, as long as the original distribution has a well-defined mean and variance. The sampling distribution of the sample means will approach a normal distribution as the sample size increases.
What happens to the sampling distribution as the sample size increases?
-As the sample size increases, the sampling distribution becomes more closely approximated by a normal distribution. It also becomes more concentrated around the true population mean, leading to lower variability in the sample means.
What are skewness and kurtosis, and how do they relate to the normality of a distribution?
-Skewness measures the asymmetry of a distribution around its mean, while kurtosis measures the 'tailedness' of the distribution compared to a normal distribution. A distribution with zero skewness is symmetrical, and a distribution with zero kurtosis has the same shape as a normal distribution, with neither excessively fat nor thin tails.
How can we experimentally demonstrate the central limit theorem?
-We can use simulation tools, like the app from onlinestatbook.com, to generate random samples from a non-normal distribution and calculate their means. By plotting these sample means, we can observe how the sampling distribution evolves towards a normal distribution as the sample size and number of trials increase.
What is the expected mean of the sampling distribution of the sample mean?
-The expected mean of the sampling distribution of the sample mean is equal to the mean of the original population distribution. This is because the law of large numbers ensures that the average of the sample means converges to the true population mean as the sample size grows.
What is the role of standard deviation in the context of the central limit theorem?
-The standard deviation of the original distribution affects the standard error of the mean (SEM) in the sampling distribution. The SEM decreases as the square root of the sample size increases, leading to a tighter clustering of sample means around the population mean.
Outlines
📊 Introduction to the Central Limit Theorem
This paragraph introduces the central limit theorem, a fundamental concept in statistics. It explains that any distribution with a well-defined mean and standard deviation can be used to create sample means, which, when plotted, approach a normal distribution. The video uses an app from onlinestatbook.com to visually demonstrate this theorem by creating a custom distribution and simulating the sampling distribution of the sample mean. The importance of understanding the central limit theorem for grasping statistical concepts is emphasized.
🎲 Simulation of Sampling Distribution
The paragraph delves into the simulation of the sampling distribution through the use of an online app. It describes how random numbers are generated according to a given probability distribution function and how the means of these samples are plotted to form a distribution. The video demonstrates this by taking samples of size five and running 10,000 trials, showing that the resulting distribution closely resembles a normal distribution. The paragraph also touches on the concepts of skew and kurtosis as measures of how normal a distribution is.
🔍 Effect of Sample Size on Normal Distribution
This part of the script discusses the impact of sample size on the normality of the sampling distribution. It explains that as the sample size increases, the distribution becomes more normal, with a lower skew and less kurtosis. The video illustrates this by comparing the results of 10,000 trials with sample sizes of 5 and 25, highlighting that larger sample sizes result in a tighter fit around the mean and a more accurate representation of a normal distribution. The conclusion emphasizes the practical significance of the central limit theorem and encourages further exploration of the topic.
Mindmap
Keywords
💡Central Limit Theorem
💡Distribution
💡Mean
💡Standard Deviation
💡Sampling Distribution
💡Sample Size
💡Skew
💡Kurtosis
💡Probability Distribution Function
💡Random Variable
💡Normal Distribution
Highlights
The central limit theorem is introduced as a profound idea in statistics.
Any distribution with a well-defined mean and standard deviation can be used with the central limit theorem.
The theorem involves taking samples of a random variable and calculating their means.
The frequency distribution of sample means approaches a normal distribution as the sample size increases.
The sampling distribution of the sample mean is the distribution derived from samples of the original distribution.
The mean of the sampling distribution is the same as the original distribution.
A non-normal distribution can be used to generate a sampling distribution that approximates a normal distribution.
The app from onlinestatbook.com is used for visualizing the sampling distribution of the sample mean.
A custom distribution can be created within the app to understand the sampling distribution better.
The app simulates taking samples and plotting the means to demonstrate the central limit theorem.
The larger the sample size, the more the sampling distribution resembles a normal distribution.
The skew and kurtosis of the sampling distribution change with different sample sizes, affecting how normal it appears.
Positive skew indicates a larger right tail, while negative skew indicates a larger left tail.
Positive kurtosis results in fatter tails and a more pointy peak, whereas negative kurtosis has smaller tails and is smoother near the middle.
The central limit theorem applies to any distribution, even very non-normal ones.
The applet at onlinestatbook.com allows users to experiment with different distributions to understand the central limit theorem.
As the sample size increases, the sampling distribution becomes a tighter fit around the mean.
Transcripts
Browse More Related Video
Central limit theorem | Inferential statistics | Probability and Statistics | Khan Academy
The Central Limit Theorem, Clearly Explained!!!
The Central Limit Theorem - understanding what it is and why it works

Sampling distribution of the sample mean 2 | Probability and Statistics | Khan Academy
7. Confidence Intervals
Central Limit Theorem - Sampling Distribution of Sample Means - Stats & Probability
5.0 / 5 (0 votes)
Thanks for rating: