Paired t Test | Statistics Tutorial #21| MarinStatsLectures
TLDRThe video script introduces the paired t-test, a statistical method used to compare the means of two related groups, such as before and after treatment measurements. It explains the concept of pairing to reduce variability and focuses on the hypothesis testing and confidence intervals. The example given involves measuring the effectiveness of a drug on systolic blood pressure, with a step-by-step explanation of calculating the mean difference, standard deviation, and the test statistic. The script emphasizes the importance of understanding statistical significance versus clinical significance and mentions alternatives like the Wilcoxon signed-rank test for nonparametric approaches.
Takeaways
- 🧪 The paired t-test is a statistical method used to compare the means of two paired or matched groups, often to reduce biological variability.
- 📊 It is a parametric test suitable for large samples and assumes that the differences between the paired observations are normally distributed.
- 🔄 The concept of pairing can involve measuring the same individual before and after a treatment or matching individuals based on certain variables like age and gender.
- 🩸 An example given in the script is measuring the effect of a drug on systolic blood pressure before and after treatment.
- 📈 Visualization techniques like side-by-side boxplots or paired plots can help understand the data trend.
- 🎯 The goal of the paired t-test is to determine if there is a statistically significant difference between the paired groups, such as a decrease in blood pressure.
- 🚫 The null hypothesis for a paired t-test is that there is no difference between the means of the paired groups, while the alternative hypothesis suggests there is a decrease.
- 📊 The test statistic is calculated based on the mean difference and the standard error, with a one-tailed test used for simplicity in the example.
- 🎲 The p-value obtained from the t-test helps in making a decision about the null hypothesis, with a low p-value suggesting its rejection in favor of the alternative.
- 🔗 Confidence intervals provide additional information about the reliability of the mean difference, with a 95% interval used to estimate the average change.
- 🔄 It's important to note the difference between statistical significance and clinical or scientific significance, as a statistically significant result may not always be clinically meaningful.
- 🚨 The script also mentions that if the assumptions of the paired t-test are not met, nonparametric approaches like the Wilcoxon signed-rank test or resampling methods can be considered.
Q & A
What is a paired t-test?
-A paired t-test is a statistical method used to compare the means of two related groups or pairs. It is a parametric test suitable for large samples and assumes that the data follows a normal distribution.
Why is pairing or matching used in studies?
-Pairing or matching is used to reduce biological variability between the groups by ensuring that the individuals in each group are as similar as possible in terms of certain variables like age, gender, or other important factors.
How does a before-and-after experiment relate to a paired t-test?
-In a before-and-after experiment, the same individuals are measured under two different conditions, such as before and after receiving a treatment. This type of data is ideal for a paired t-test, as it allows for the comparison of the treatment's effect on each individual's outcome.
What is the null hypothesis in a paired t-test?
-The null hypothesis in a paired t-test is that there is no difference between the means of the paired groups, or equivalently, the mean difference between the before and after measurements is equal to zero.
What is the alternative hypothesis for a paired t-test?
-The alternative hypothesis for a paired t-test is that the mean after treatment is less than the mean before treatment, indicating that there is a statistically significant decrease in the variable of interest, such as systolic blood pressure.
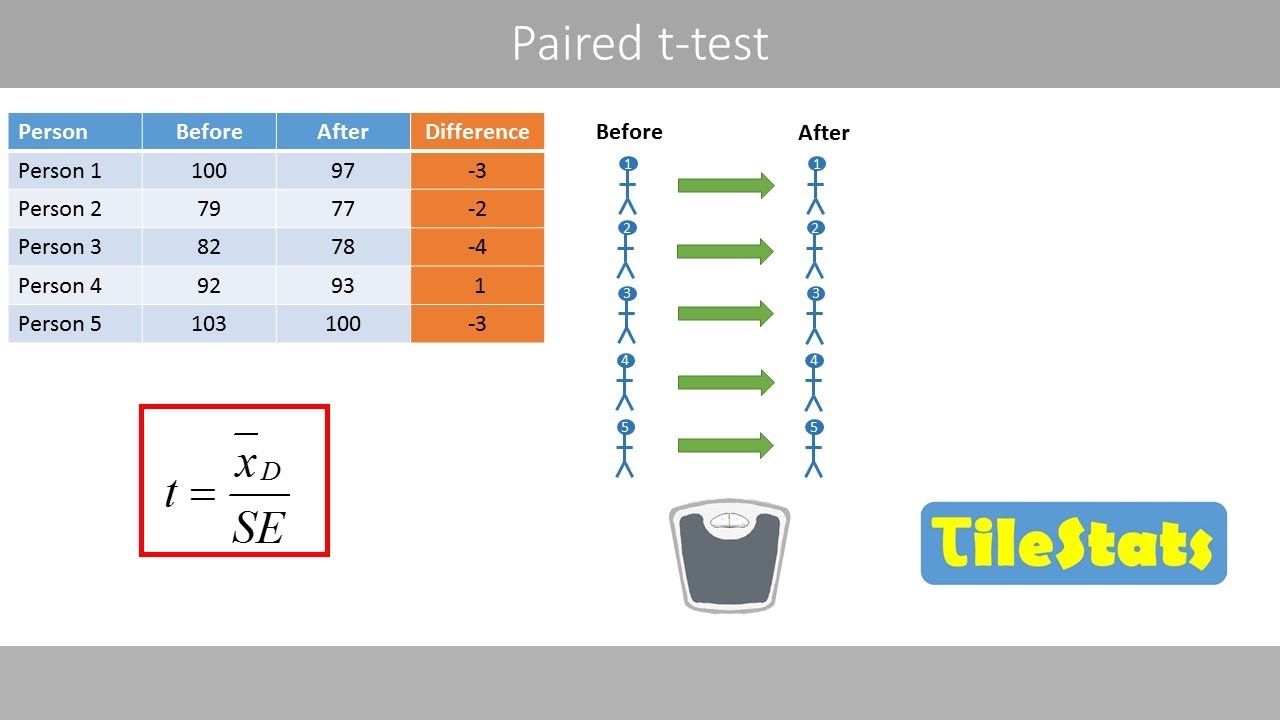
How is the mean difference calculated in a paired t-test?
-The mean difference (D-bar) is calculated by summing the individual differences (after minus before measurements) and dividing by the sample size, giving the average change between the paired measurements.
What is the role of the standard deviation of differences in a paired t-test?
-The standard deviation of differences measures the average distance that individual differences deviate from the mean difference, providing an understanding of the variability in the changes observed between the paired measurements.
How is the t-test statistic calculated in a paired t-test?
-The t-test statistic is calculated by dividing the mean difference by its standard error (the standard deviation of differences divided by the square root of the sample size). This value indicates how many standard errors the observed mean difference is from the hypothesized mean difference (zero in the null hypothesis).
What is the significance of the p-value in a paired t-test?
-The p-value in a paired t-test indicates the probability of observing a difference as extreme as, or more extreme than, the one observed if the null hypothesis is true. A small p-value (typically less than 0.05) suggests that the observed difference is unlikely to have occurred by chance, leading to the rejection of the null hypothesis.
How does a confidence interval complement the results of a paired t-test?
-A confidence interval provides a range of values within which the true mean difference is likely to fall with a certain level of confidence (e.g., 95%). It gives additional information about the precision of the estimate and the likely magnitude of the effect, which is not provided by the hypothesis test alone.
What are the assumptions of a paired t-test?
-The assumptions of a paired t-test include having a simple random sample, independent observations within each group, paired or dependent groups, and that the differences between the paired measurements are approximately normally distributed, especially for large sample sizes.
What are nonparametric alternatives to a paired t-test for situations where assumptions are not met?
-In cases where the assumptions of a paired t-test are not met, nonparametric alternatives such as the Wilcoxon signed-rank test can be used. Additionally, bootstrapping or resampling methods can be employed when dealing with small sample sizes or when normality cannot be assumed.
Outlines
📊 Introduction to Paired t-Tests
This paragraph introduces the concept of paired t-tests, a statistical method used to compare the means of two related groups or matched samples. It explains the rationale behind pairing or matching subjects to reduce variability and increase the sensitivity of the test. The example provided involves measuring systolic blood pressure before and after a treatment to assess the drug's effectiveness. The paragraph emphasizes understanding the concepts rather than calculations and sets the stage for further discussion on hypothesis testing and confidence intervals in the context of paired data.
📈 Calculating and Interpreting Paired t-Test Results
This section delves into the specifics of calculating the mean difference and standard deviation of differences in a paired t-test. It describes how to compute the average difference (D-bar) and the standard deviation of differences (sD) from the data. The paragraph then explains the process of hypothesis testing, focusing on the one-tailed test with the null hypothesis stating no change in mean blood pressure after treatment. The test statistic is calculated, and its significance is interpreted using a p-value, leading to the conclusion that there is a statistically significant decrease in blood pressure after treatment.
🔍 Confidence Intervals and Assumptions of Paired t-Tests
The final paragraph discusses the construction of a confidence interval for the mean difference, providing a range within which the true mean difference is likely to fall. It highlights the importance of considering both statistical significance and clinical or scientific significance. The paragraph also addresses the assumptions underlying paired t-tests, such as simple random sampling, independent observations, paired groups, and normally distributed differences. It concludes by mentioning alternative nonparametric approaches like the Wilcoxon signed-rank test for situations where these assumptions may not be met.
Mindmap
Keywords
💡paired t-test
💡biological variability
💡matched groups
💡before and after experiment
💡hypothesis testing
💡confidence interval
💡standard deviation
💡t-distribution
💡p-value
💡statistical significance
💡clinical significance
Highlights
Introduction to paired t-tests, a parametric approach used for comparing the means of two paired or matched groups.
Paired groups can be the same individual measured before and after a treatment or matched individuals on different treatments.
The purpose of pairing is to reduce biological variability between the groups, making them as identical as possible.
Example given is a before-and-after experiment measuring systolic blood pressure before and after treatment.
Visualization techniques like side-by-side boxplots and paired plots can be used to compare before and after measurements.
The goal is to determine if a drug is effective in decreasing systolic blood pressure.
Hypothesis testing concepts are applied to build up a paired t-test and confidence interval for two paired groups.
Null hypothesis states that the mean systolic blood pressure after treatment is the same as before treatment.
Alternative hypothesis suggests that the mean after is less than the mean before, indicating a decrease.
The paired t-test is a one-sided test for simplicity, but it can be written as a two-sided test.
The concept of estimating the difference in means and testing hypotheses based on this estimate is discussed.
Calculation of the mean difference (D-bar) and the standard deviation of differences (sD) are explained.
The test statistic is calculated as the difference between the sample mean and the hypothesized mean, in terms of standard errors.
The P-value interpretation is used to make a decision about the null hypothesis, with a small P-value leading to its rejection.
A 95% confidence interval is constructed to provide a range within which the true mean difference is likely to fall.
The difference in blood pressure is statistically significant if the confidence interval does not include zero.
Statistical significance is distinguished from scientific or clinical significance, with the latter focusing on the meaningfulness of the results.
Assumptions of the paired t-test include simple random sampling, independent observations, paired groups, and normally distributed differences.
Nonparametric approaches like the Wilcoxon signed-rank test are suggested for situations where assumptions are not met.
Transcripts
Browse More Related Video

Paired t-Test in R with Examples | R Tutorial 4.7 | MarinStatsLectures
Wilcoxon Signed Rank Test in R with Example | R Tutorial 4.8 | MarinStatsLectures
Wilcoxon Signed Rank Test | Statistics Tutorial #22 | MarinStatsLectures
The paired t-test | explained with a simple example
Two-Sample t Test in R (Independent Groups) with Example | R Tutorial 4.2 | MarinStatsLectures

Elementary Stats Lesson # 21
5.0 / 5 (0 votes)
Thanks for rating: