Wilcoxon Signed Rank Test in R with Example | R Tutorial 4.8 | MarinStatsLectures
TLDRIn this informative video, Mike Marin introduces the Wilcoxon Signed Rank Test, a non-parametric statistical method for analyzing median differences in paired populations. Using R software, he demonstrates the test with systolic blood pressure data before and after treatment. Viewers learn to use the 'wilcox.test' function, interpret results like the test statistic, p-value, and confidence interval, and understand the implications of ties and zero differences on exact calculations. The tutorial also covers adjusting test parameters for approximate results and the importance of continuity correction.
Takeaways
- 📚 The video is a tutorial on the Wilcoxon Signed Rank Test, a non-parametric statistical method used for paired or dependent populations.
- 🧬 The example data involves measurements of systolic blood pressure before and after a treatment, with 25 paired observations.
- 💡 The 'wilcox.test' function in R is used to conduct the Wilcoxon Signed Rank Test.
- 🔍 A boxplot is suggested for visual examination of the data to compare before and after measurements.
- ❓ The null hypothesis tested is that the median change in systolic blood pressure is zero.
- 📉 The test is two-sided, meaning it checks for any difference from the median, not just an increase or decrease.
- 🔧 The 'mu' parameter is set to 0 in the 'wilcox.test' function to test if the median difference is zero.
- 🔄 The 'paired' argument is set to TRUE to indicate that the measurements are paired.
- 📊 The 'conf.int' and 'conf.level' arguments can be used to obtain a confidence interval for the results.
- ⚠️ Warnings are provided when exact p-values and confidence intervals cannot be calculated due to ties or zero differences.
- 🔄 The 'exact' argument can be set to FALSE for approximate calculations when exact values are not possible.
- 🔧 The 'correct' argument can be set to FALSE to disable continuity correction in the test.
- 📈 The test result includes a test statistic of 267, a p-value of 0.00082, and a 99% confidence interval from 2 to 14, with a sample median difference of 7.5.
- 🎥 The next video in the series will discuss one-way analysis of variance (ANOVA).
Q & A
What is the Wilcoxon Signed Rank Test used for in statistics?
-The Wilcoxon Signed Rank Test is a non-parametric statistical method used to examine the median difference between two related populations or paired samples.
What kind of data does the Wilcoxon Signed Rank Test require?
-The test requires paired or dependent data, such as measurements taken before and after an event or treatment.
What is the purpose of the 'wilcox.test' command in R?
-The 'wilcox.test' command in R is used to perform the Wilcoxon Signed Rank Test, allowing for the comparison of differences in paired observations.
Why might one examine a boxplot of the data before conducting the Wilcoxon test?
-Examining a boxplot helps visualize the distribution of the data and can provide initial evidence of the differences between the paired observations, such as changes in blood pressure before and after treatment.
What is the null hypothesis being tested in the script's example?
-The null hypothesis is that the median change in systolic blood pressure is 0, implying no significant difference between the before and after measurements.
What does it mean to conduct a two-sided test in the context of the Wilcoxon Signed Rank Test?
-A two-sided test means that the alternative hypothesis is that the median difference is not equal to zero, allowing for the possibility of the median being either higher or lower after the treatment.
How can one set up the 'wilcox.test' function in R to test for a median difference of zero?
-In the 'wilcox.test' function, one can set the 'mu' argument to 0 to test if the median difference is zero, and set the 'paired' argument to TRUE to indicate that the samples are paired.
What is the significance of the 'conf.int' and 'conf.level' arguments in the 'wilcox.test' function?
-The 'conf.int' argument, when set to TRUE, returns a confidence interval for the median difference, and the 'conf.level' argument specifies the level of confidence for the interval, such as 99%.
What does the 'exact' argument in the 'wilcox.test' function control?
-The 'exact' argument controls whether R should calculate exact p-values and confidence intervals. Setting it to FALSE asks R to calculate approximate values when exact calculations are not possible, such as in the presence of ties.
What is the purpose of the 'correct' argument in the 'wilcox.test' function?
-The 'correct' argument, when set to FALSE, tells R not to apply a continuity correction when calculating the test statistic, which can be used in cases where the exact distribution is used.
What results were obtained from the Wilcoxon test in the script?
-The test resulted in a test statistic of 267, a p-value of 0.00082, indicating a statistically significant difference, and a 99% confidence interval from 2 to 14 for the median difference in systolic blood pressure.
Outlines
📊 Introduction to Wilcoxon Signed Rank Test in R
In this video, Mike Marin introduces the Wilcoxon Signed Rank Test, a non-parametric statistical method used to evaluate the median difference between two related populations. The context provided is a study of systolic blood pressure changes before and after a treatment, with 25 paired observations. The video demonstrates the use of R software to perform this test, starting with importing and examining the data visually through a boxplot. The 'wilcox.test' function in R is highlighted as the primary tool for conducting the test, with a focus on testing the null hypothesis that the median change in blood pressure is zero, using a two-sided test approach.
🔍 Conducting the Wilcoxon Signed Rank Test with R
The script details the steps to conduct the Wilcoxon Signed Rank Test in R, including accessing help for the 'wilcox.test' function and setting up the test with specific arguments. The 'mu' argument is set to zero to test for no difference in medians, 'alt' is set to 'two.sided' for a two-sided test, and 'paired' is set to TRUE to indicate the paired nature of the data. The script also discusses the option to include a confidence interval by setting 'conf.int' to TRUE and specifying the 'conf.level'. The output of the test, including the test statistic, p-value, confidence interval, and sample median difference, is explained, along with the implications of ties in the ranks and the option to calculate approximate values by setting 'exact' to FALSE.
📚 Conclusion and Upcoming Content
The video concludes with a summary of the results obtained from the Wilcoxon Signed Rank Test, including the test statistic of 267, a p-value of 0.00082, and a 99% confidence interval ranging from 2 to 14, indicating a significant median difference in systolic blood pressure post-treatment. The script also teases the next topic in the series, which will be one-way analysis of variance (ANOVA), and encourages viewers to subscribe to 'marinstatslectures' for further statistical insights.
Mindmap
Keywords
💡Wilcoxon Signed Rank Test
💡R Statistical Software
💡non-parametric
💡paired observations
💡boxplot
💡null hypothesis
💡two-sided test
💡wilcox.test
💡p-value
💡confidence interval
💡ties
💡continuity correction
Highlights
Introduction to the Wilcoxon Signed Rank Test by Mike Marin.
The test is a non-parametric method for examining median differences in paired populations.
The use case involves systolic blood pressure measurements before and after treatment.
Data consists of 25 paired observations.
Importing and attaching data in R Statistical Software.
Exploring changes in systolic blood pressure using the 'wilcox.test' command in R.
Using the Help menu in R for command assistance.
Visual analysis with a boxplot to compare before and after measurements.
Null hypothesis testing for a median change of 0 in systolic blood pressure.
Conducting a two-sided test using 'wilcox.test' with the 'alt' argument set to 'two.sided'.
Setting the 'paired' argument to TRUE for paired measurements.
Obtaining a confidence interval with the 'conf.int' and 'conf.level' arguments.
Handling ties and differences of 0 in rank calculations.
Using the 'exact' argument to calculate approximate p-values and confidence intervals.
Disabling continuity correction with the 'correct' argument.
Results presentation including test statistic, p-value, confidence interval, and median difference.
Upcoming discussion on one-way ANOVA in the next video.
Encouragement to subscribe to MarinStatsLectures for more statistical insights.
Transcripts
Browse More Related Video

Paired t-Test in R with Examples | R Tutorial 4.7 | MarinStatsLectures

Mann Whitney U / Wilcoxon Rank-Sum Test in R | R Tutorial 4.3 | MarinStatsLectures
Two-Sample t Test in R (Independent Groups) with Example | R Tutorial 4.2 | MarinStatsLectures

Paired t Test | Statistics Tutorial #21| MarinStatsLectures
Permutation Hypothesis Test in R with Examples | R Tutorial 4.6 | MarinStatsLectures
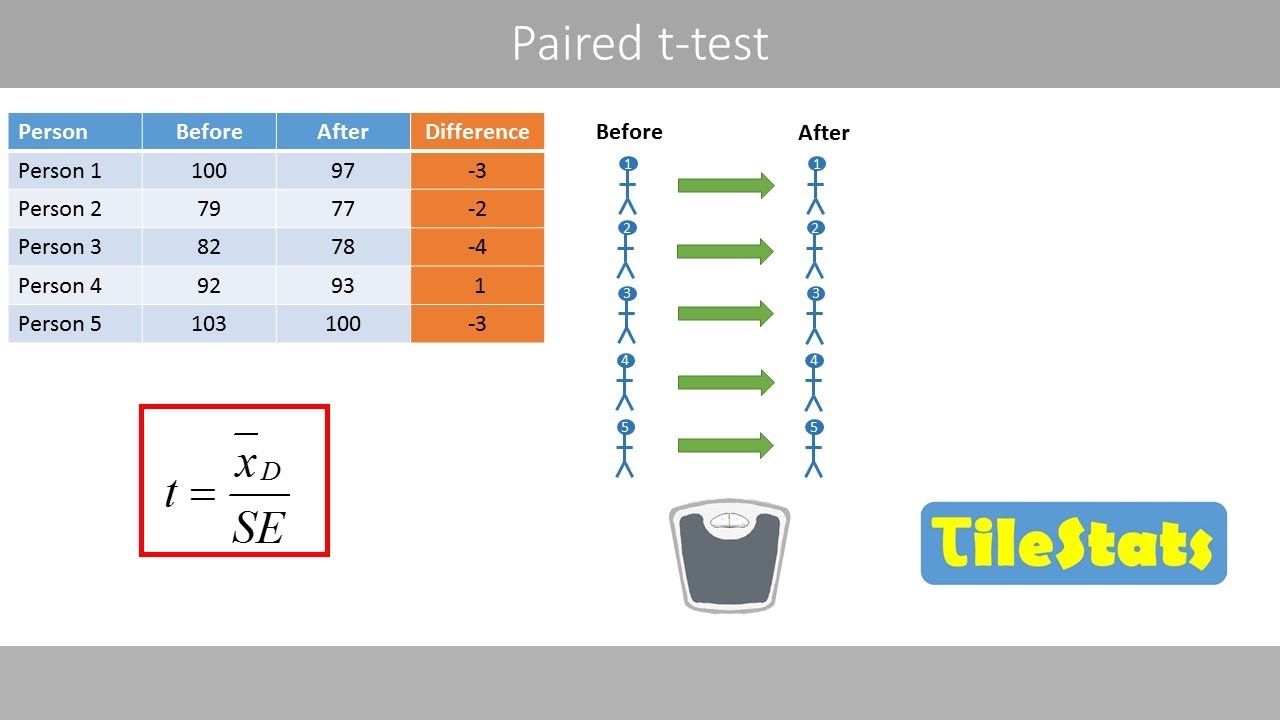
The paired t-test | explained with a simple example
5.0 / 5 (0 votes)
Thanks for rating: