Elementary Stats Lesson # 21
TLDRThis educational video script delves into statistical inference for comparing two population means, focusing on paired samples or dependent samples. It explains the process of designing research studies to compare treatments, such as a new versus old drug, using either independent sampling or paired sampling strategies. The script provides detailed steps for performing hypothesis testing and constructing confidence intervals for the mean difference, utilizing t-tests and t-intervals. Examples include comparing hotel prices, reaction times post-alcohol consumption, and car gas mileage after tune-ups, emphasizing the robustness of t-procedures and the importance of data normality checks.
Takeaways
- 📚 The script discusses statistical inference for comparing two population means, specifically focusing on two-sample problems and treatments.
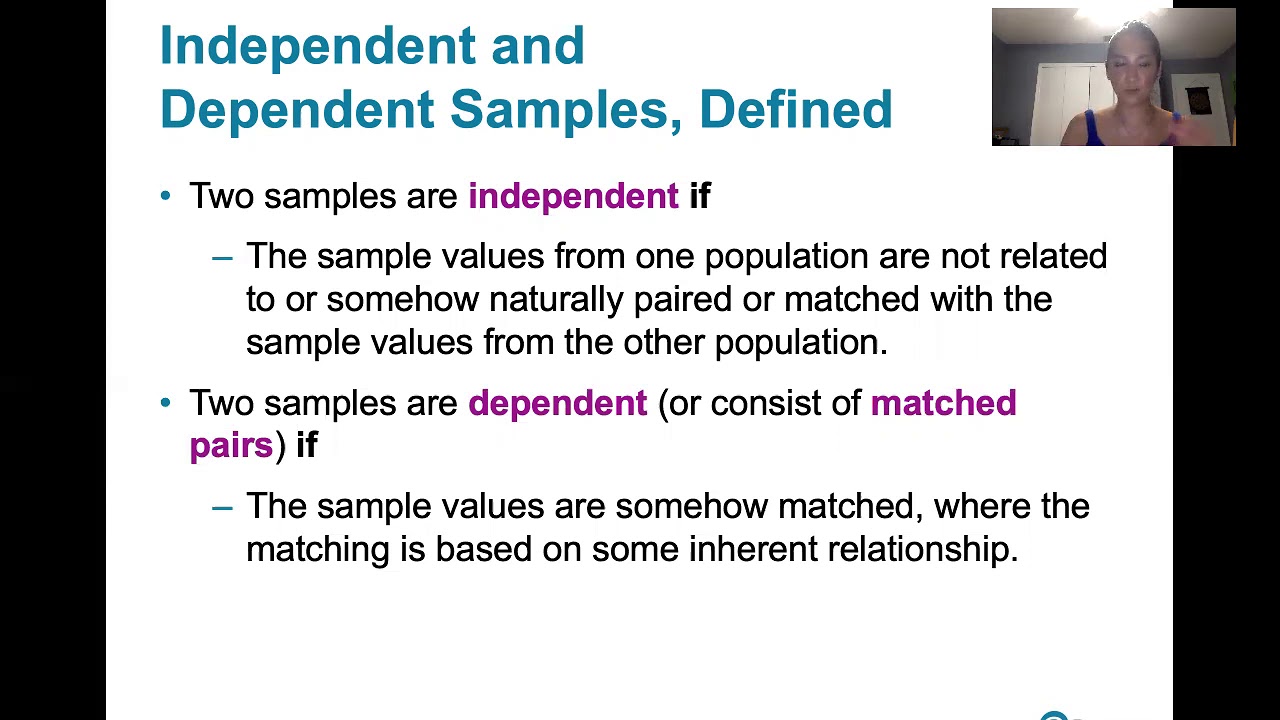
- 🔑 It introduces the concepts of dependent (paired) and independent sampling, highlighting the differences in how they are treated statistically.
- 👨🔬 The lesson builds upon previous knowledge of single population mean inference, applying it to scenarios with paired samples, such as comparing the efficacy of two treatments.
- 💊 A research study example is presented to illustrate the comparison between an old and new drug's effectiveness in reducing blood pressure.
- 📈 The script explains how to perform inference procedures for two samples, including calculating confidence intervals and hypothesis testing for the mean difference.
- 📊 It emphasizes the importance of distinguishing between paired and independent samples, noting that paired samples require equal sample sizes.
- 📝 The parameter of interest in these studies is often the difference in means (mu1 - mu2), which is the focus for both confidence intervals and hypothesis tests.
- 🔢 The process involves calculating the sample mean difference (d-bar) and the standard deviation of the differences, which are key for constructing confidence intervals.
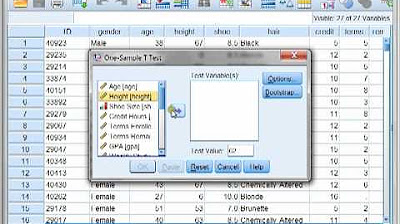
- 📉 The script provides a step-by-step guide on how to use a calculator to perform one-variable statistics, t-tests, and t-intervals for paired samples.
- 🚫 It warns against using t-procedures when data sets have outliers or are not normally distributed, especially in small sample sizes, as they are not robust in such cases.
- 🚗 Finally, the script touches on 'before and after' designs as a common application of paired data, providing examples related to reaction times and car tune-up effects.
Q & A
What is the main focus of Chapter 11 in the lesson?
-The main focus of Chapter 11 is on two-sample inference, comparing two populations or treatments, particularly when the variable of interest is an average or mean value.
What are the two types of samples discussed in the lesson?
-The lesson discusses independent samples and dependent (or paired) samples.
How is an independent sample design described in the lesson?
-In an independent sample design, two simple random samples are selected from the population. One sample receives the old treatment and the other the new treatment. Blood pressure is measured for both samples to compare the two population means.
How is a dependent sample design different from an independent sample design?
-In a dependent sample design, a single simple random sample is selected. Each individual is measured under the old treatment, then the new treatment, resulting in paired data for analysis.
What is the parameter of interest in the dependent sample design?
-The parameter of interest is the population mean difference (mu sub d), which is the average of the differences between the paired measurements.
What conditions must be met for using t procedures for matched pairs data?
-The sample must be a simple random sample, consist of matched pairs, and the differences must be normally distributed or the sample size should be at least 30.
How do you calculate the test statistic for a hypothesis test on matched pairs data?
-The test statistic (t) is calculated as (d bar - mu sub d) / (s sub d / sqrt(n)), where d bar is the sample mean difference, mu sub d is the hypothesized mean difference (often 0), s sub d is the sample standard deviation of the differences, and n is the number of pairs.
What does a 95% confidence interval for the mean difference indicate?
-A 95% confidence interval for the mean difference indicates a range of values within which we are 95% confident that the true population mean difference lies.
How is the confidence interval for the mean difference constructed?
-The confidence interval is constructed using the formula: d bar ± (t critical value * standard error of the mean difference), where d bar is the sample mean difference and the standard error is s sub d / sqrt(n).
What should be done if the data set for matched pairs has outliers?
-If the data set has outliers, the t procedures should not be used, as they are not accurate in the presence of outliers. Alternative robust statistical methods should be considered.
Outlines
📚 Introduction to Chapter 11: Inference on Two Means
The instructor begins by introducing Chapter 11, which focuses on comparing two populations or treatments through sample problems. The chapter specifically addresses inference when the variable of interest is an average or mean value. The lesson builds upon previous knowledge of single population mean inference and introduces the concepts of dependent samples or paired samples. The goal is to distinguish between different types of samples and their relation to one another, with an example of comparing the efficacy of a new drug to an old one in reducing blood pressure.
🔬 Research Design: Independent vs. Dependent Sampling
The video script explains the difference between independent and dependent sampling in the context of research design. Independent sampling involves selecting two separate random samples from a population, with no link between the individuals in each sample. In contrast, dependent or paired sampling involves taking measurements on the same individuals under two different conditions, creating paired data. The script uses the example of a study comparing the effectiveness of a new and old drug on blood pressure, illustrating both independent and dependent sampling strategies.
📉 Inference for Paired Samples: Analyzing Differences
The script delves into the inference process for paired samples, emphasizing the analysis of differences within pairs. It discusses how to calculate the sample mean difference and the standard deviation of differences, which are essential for constructing confidence intervals and conducting hypothesis tests. The parameter of interest is the mean difference (μ_d), and the procedures for inference are similar to those used for a single population mean, adapted for paired data.
📝 Understanding Independent and Dependent Samples in Research
The instructor clarifies the definitions of independent and dependent samples in research. Independent samples are observations where one sample does not influence the other, and the sample sizes may vary. Dependent samples, or paired samples, involve measurements on the same individuals, requiring equal sample sizes. The lesson aims to adjust inference procedures to work with differences in matched groups, using the sample differences to estimate the population mean difference.
📊 Confidence Intervals for Matched Pairs Data
The script explains how to construct confidence intervals for the mean difference in matched pairs data. It outlines the formula for a confidence interval and the three components needed: the point estimate, the standard error estimate, and the critical value from the t-distribution. The example provided uses data on hotel prices to demonstrate the process of creating a 90% confidence interval for the mean price difference between Hampton and LaQuinta hotels.
🧮 Calculating Confidence Intervals Using a Calculator
The instructor demonstrates how to use a calculator to calculate a confidence interval for a set of differences. The process involves inputting the differences into the calculator, calculating the mean and standard deviation, and then using the calculator's built-in t-interval program to find the interval. The example shows a comparison between the costs of one-night stays at Hampton and LaQuinta hotels, with the calculator providing a more efficient method for constructing the confidence interval.
🔍 Hypothesis Testing for Matched Pairs Data
The script discusses hypothesis testing for matched pairs data, using the same data from the hotel price example. It outlines the conditions for testing the mean difference, including simple random sampling and normal distribution of differences. The hypothesis test involves setting up null and alternate hypotheses, determining the significance level, calculating the test statistic, and converting it into a p-value to make a decision about the null hypothesis.
📉 Performing Hypothesis Testing Using a Calculator
The instructor shows how to use a calculator to perform a hypothesis test on a set of differences. The process involves running a t-test on the data, setting the null hypothesis to zero, and specifying the direction of the alternative hypothesis. The calculator provides the test statistic and the p-value, which are used to make a decision about the null hypothesis. The example demonstrates a significant difference in hotel prices between Hampton and LaQuinta, rejecting the null hypothesis.
🚗 Before and After Designs: Application of Paired Data
The script concludes with examples of before and after designs, which are a type of paired data analysis. These designs are common in research to control for confounding factors. The examples include reaction times after alcohol consumption and gas mileage before and after a car tune-up. The data from these studies are used to construct confidence intervals and perform hypothesis tests to determine the mean difference in reaction times and gas mileage, respectively.
🛠 Tuning Up Cars for Better Gas Mileage: Hypothesis Testing
The final part of the script focuses on a hypothesis test for a before and after design, specifically testing whether tuning up a car improves its gas mileage. The data shows the mileage of eight cars before and after a tune-up, with differences indicating an improvement in mileage. The hypothesis test is conducted at a 5% significance level, using a t-test to determine if there is strong evidence that the mean difference in mileage is greater than zero after a tune-up.
🔚 Conclusion and Preview of Upcoming Lessons
The instructor wraps up the lesson by summarizing the key points about inference for paired samples and before and after designs. They also preview the next lesson, which will cover t procedures for independent samples, explaining the need to adapt the calculations to account for the lack of pairing in the data.
Mindmap
Keywords
💡Inference
💡Dependent Samples
💡Independent Samples
💡Mean Difference
💡Confidence Interval
💡Hypothesis Testing
💡T-Test
💡Standard Error
💡Degrees of Freedom
💡Normal Distribution
💡Paired Data
💡Significance Level
Highlights
Introduction to Chapter 11 focusing on two-sample inference problems to compare populations or treatments.
Exploring inference about two means, building upon single population mean inference.
Distinguishing between dependent (paired) and independent sampling in research studies.
Designing studies to compare the efficacy of a new drug to an old one using blood pressure as a metric.
Independent sampling strategy involving separate random samples for each treatment.
Dependent sampling strategy where the same individuals receive both the old and new drug.
The importance of the parameter of interest, the difference in means (mu1 - mu2).
Adjusting inference procedures for paired samples to work with differences within pairs.
Definition and identification of independent versus dependent samples in research design.
Notation and calculations for matched pairs, including sample mean difference (d-bar) and standard deviation (s_d).
Inference procedures for dependent sampling, focusing on the mean difference of the population.
Overview of confidence intervals and hypothesis testing for matched pairs data.
Building a confidence interval for the mean difference in prices between Hampton and LaQuinta hotels.
Hypothesis testing for matched pairs data, with an example using hotel prices.
Robustness of t procedures in inference, applicable even with minor departures from normality.
Caution regarding the use of t procedures with outliers or in small datasets.
Use of box plots and normal probability plots to check for normality in paired data.
Application of paired data designs in before-and-after scenarios, such as reaction times post-alcohol consumption.
Example of a before-and-after design testing the impact of a car tune-up on gas mileage.
Conclusion and预告 of the next lesson, which will address independent samples and their associated t procedures.
Transcripts
Browse More Related Video


5.0 / 5 (0 votes)
Thanks for rating: