AP Physics 2023 Exam Solutions|Q2. PART D | Complete Step-by-Step Answers and Explanations"
TLDRIn this educational video, the instructor explores the concept of acceleration on an inclined plane, emphasizing that it remains constant regardless of the cart's direction—up or down the ramp. Assuming no friction, the acceleration is attributed to gravity's component. The lesson delves into the physics of motion, providing the formula for displacement and velocity as functions of time. The instructor illustrates how to graph these variables, demonstrating the parabolic position-time graph and the linear velocity-time graph for a cart pushed upwards with an initial velocity, highlighting the point at which the cart's velocity becomes zero.
Takeaways
- 📚 The script is a part of the AP1 physics curriculum discussing the concept of acceleration on an inclined plane.
- 🚀 The student aims to confirm that acceleration remains constant whether the cart rolls up or down the ramp.
- 🔄 The scenario assumes no friction or air resistance, focusing solely on the component of gravity affecting the acceleration.
- 📏 The x-axis is defined parallel to the ramp, with the origin at the starting point.
- 📈 The acceleration due to gravity along the ramp is constant, regardless of the cart's direction of motion.
- 🛤️ The student starts the cart at the bottom of the ramp and gives it an initial push upwards.
- 📊 The position and velocity of the cart are to be graphed as functions of time for the scenario described.
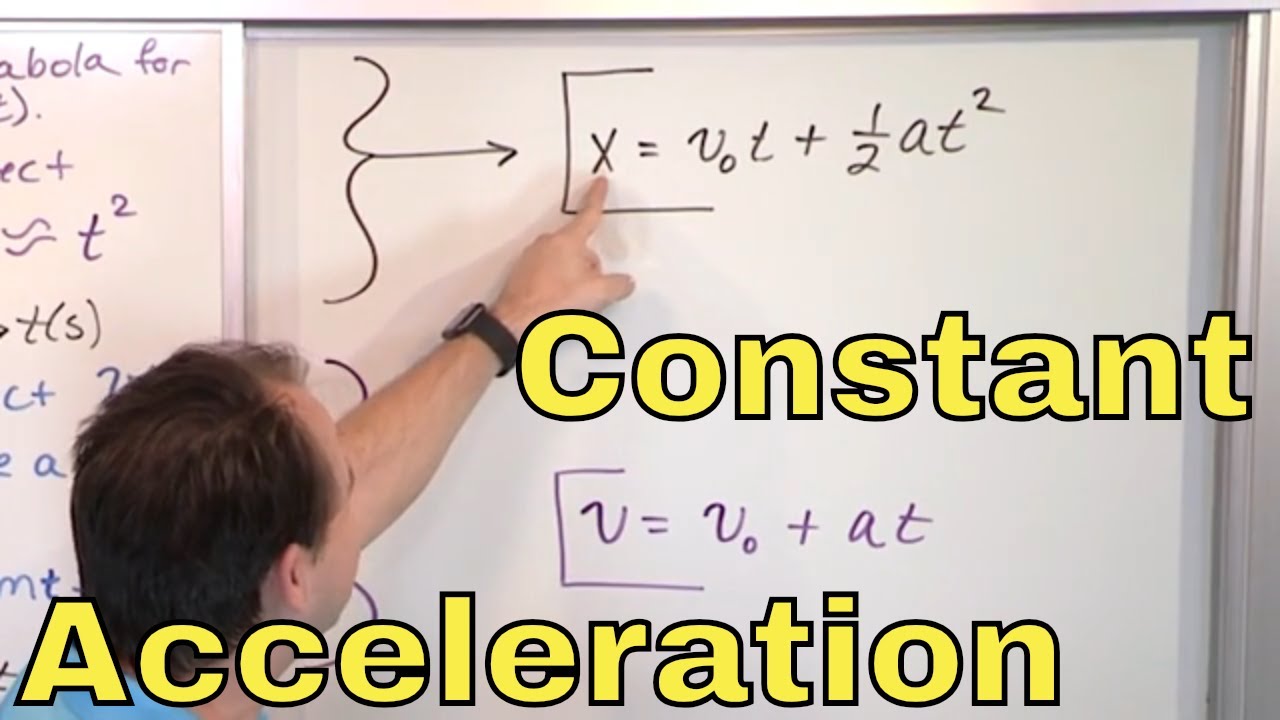
- 📚 The displacement formula used is \( s = ut + \frac{1}{2}at^2 \), where \( u \) is the initial velocity, \( a \) is the acceleration, and \( t \) is time.
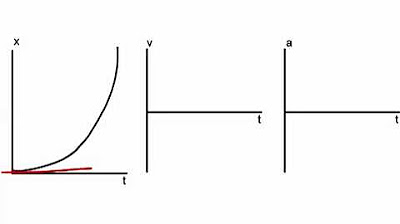
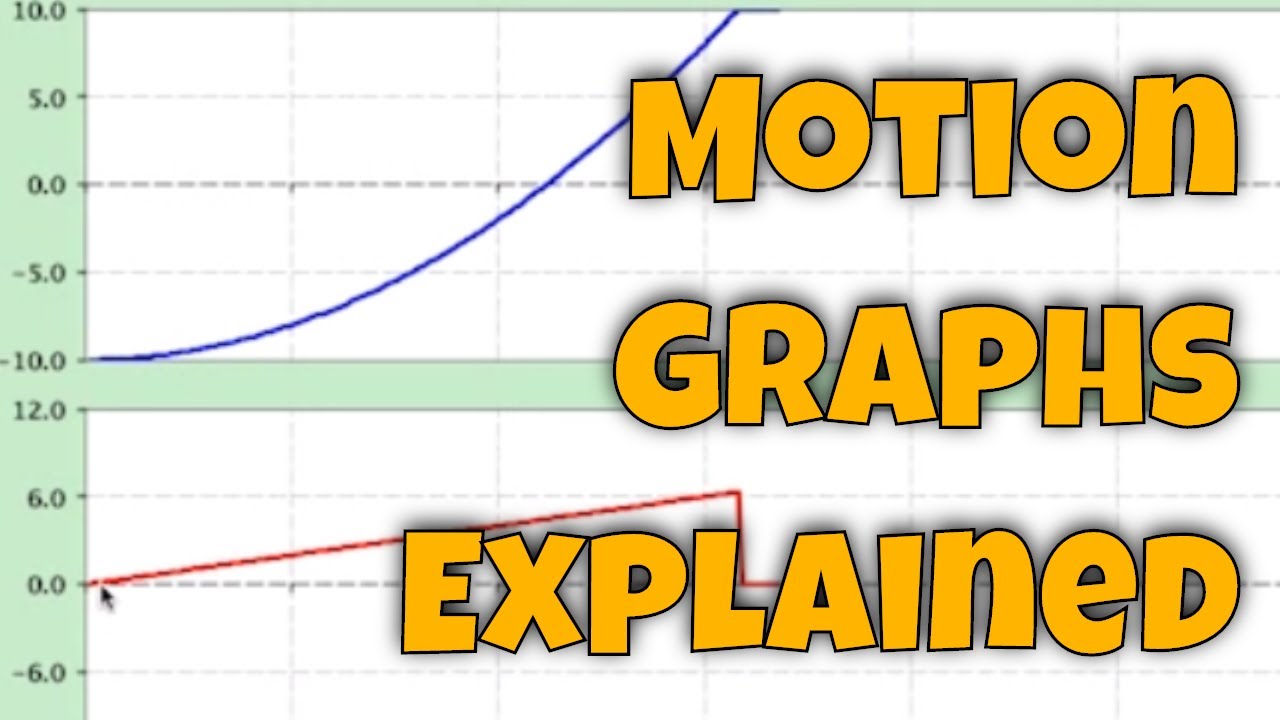
- 📉 The graph of position versus time is a parabola opening upwards, indicating the cart's upward motion and eventual stop.
- 📋 The final position of the cart where it stops is marked as \( X_{final} \) on the graph.
- 🚫 The velocity-time graph is a straight line with a positive slope, starting from an initial velocity and decreasing to zero when the cart stops.
Q & A
What is the main topic discussed in this video script?
-The main topic discussed in the video script is the analysis of the acceleration of a cart moving up and down a ramp, assuming no friction and air resistance, and the corresponding position and velocity graphs as functions of time.
Why does the acceleration of the cart remain the same whether it is moving up or down the ramp?
-The acceleration of the cart remains the same because it is due to gravity, which acts in the same direction (downwards along the ramp) regardless of whether the cart is moving up or down.
What is the role of friction and air resistance in this scenario?
-In this scenario, friction and air resistance are assumed to be non-existent, which simplifies the analysis by allowing the acceleration to be solely due to gravity.
What is the initial velocity (U) mentioned in the script, and what does it represent?
-The initial velocity (U) mentioned in the script represents the speed with which the cart is pushed upwards at the start of the experiment.
How is the position of the cart as a function of time represented mathematically in the script?
-The position of the cart as a function of time is represented by the equation: Position = X₀ + (-U)t + (1/2)at², where X₀ is the initial position, U is the initial velocity, a is the acceleration, and t is time.
What type of graph does the position-time relationship form, and why?
-The position-time relationship forms a parabolic graph because the equation includes a term with t², indicating a quadratic relationship between position and time.
What is the significance of the point where the cart's velocity becomes zero?
-The point where the cart's velocity becomes zero is significant because it represents the moment and position where the cart comes to a complete stop.
How is the velocity of the cart as a function of time represented mathematically in the script?
-The velocity of the cart as a function of time is represented by the equation: Velocity = U + at, where U is the initial velocity, a is the acceleration, and t is time.
What type of graph does the velocity-time relationship form, and why?
-The velocity-time relationship forms a straight-line graph because the equation is linear, with a constant acceleration resulting in a constant rate of change of velocity.
What is the final position (Xf) of the cart when it comes to rest, and how is it determined?
-The final position (Xf) of the cart when it comes to rest is determined by the point on the position-time graph where the velocity becomes zero, indicating that the cart has stopped moving.
What additional insights can be gained from the graphs of position and velocity as functions of time?
-The graphs of position and velocity as functions of time provide insights into the motion of the cart, such as the distance traveled, the time taken to stop, and the rate at which the cart decelerates to a halt.
Outlines
🚀 Cart's Acceleration on an Inclined Plane
This paragraph discusses the concept of acceleration on an inclined plane, emphasizing that acceleration remains constant regardless of the cart's direction—whether rolling up or down the ramp. The scenario assumes no friction and air resistance, attributing the acceleration solely to gravity's component along the ramp. The paragraph also instructs to sketch the position and velocity of the cart as a function of time, given the cart is pushed upwards with an initial velocity 'U'. The displacement formula used is \( s = UT + \frac{1}{2}at^2 \), where 'a' is the acceleration due to gravity and 't' is time. The position at any time 'T' is the sum of the initial position and the displacement. The paragraph concludes with the description of a parabolic graph for position versus time, indicating the cart's upward motion and eventual stop.
📈 Graphing Motion of a Cart on an Inclined Plane
The second paragraph continues the discussion on the cart's motion, focusing on graphing its position and velocity over time. It describes the process of plotting a parabolic graph for the cart's position, which opens upwards, indicating the cart's ascent up the incline and eventual halt. The final stopping point is marked as 'X_final'. Additionally, the paragraph explains how to graph the velocity of the cart using the equation of motion \( V = U + at \), resulting in a straight-line graph with a positive slope due to the positive acceleration. The graph starts from an initial negative velocity 'U' and ends at zero velocity when the cart comes to rest at position 'XF'. The paragraph concludes with a summary of the graphical representation of the cart's motion, providing a clear visual understanding of the scenario described.
Mindmap
Keywords
💡Acceleration
💡Cart
💡Incline
💡Friction
💡Gravity
💡Initial Velocity
💡Displacement
💡Equation of Motion
💡Graph
💡Parabolic
💡Velocity
Highlights
The student aims to confirm that acceleration is consistent whether the cart rolls up or down the ramp.
The cart is started at the bottom and given an initial push upwards.
The x-axis is defined parallel to the ramp with the origin at the starting point.
Acceleration due to gravity is the same in both directions, assuming no friction.
The acceleration is due to a component of gravity acting along the ramp.
A graph is to be sketched to represent position and velocity as functions of time.
The cart is pushed upwards with an initial velocity denoted as 'U'.
The displacement formula s = UT + (1/2)at² is used for motion with constant acceleration.
The direction of initial velocity 'U' is considered negative due to the upward motion.
The position at any given time T is the sum of the initial position and displacement.
The graph of position versus time T is parabolic, opening upwards.
The cart's velocity decreases with time as it moves up the incline.
The final position where the cart stops is marked as 'X final'.
The equation of motion V = U + at is used to find the velocity at any time T.
The graph of velocity versus time T is a straight line with a positive slope.
The cart comes to rest at the point where its velocity is zero.
The explanation provides a detailed analysis of the cart's motion on the ramp.
Transcripts
Browse More Related Video

5.0 / 5 (0 votes)
Thanks for rating: