How to Use the Z Table
TLDRThe video script explains the use of the Z-table in statistics, focusing on the concept of p-values. It clarifies that p-values represent the proportion of observations to the right of a specific Z-score, illustrating this with a graph and table. The script details how to locate a Z-score in the table to find the corresponding p-value, using the first two digits for the column and the third for the row. It emphasizes the table's symmetry, indicating that p-values for positive and negative Z-scores of the same magnitude are equal, providing an example with Z = 1.23 and its p-value of 0.1093.
Takeaways
- 📊 The Z table is divided into two sections: a graph/chart and a table that lists possible p-values.
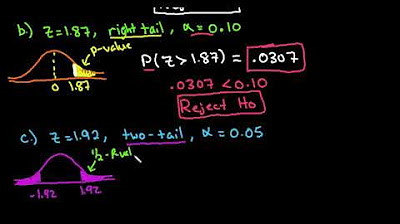
- 🔢 A p-value represents the proportion of observations that are to the right of a specific Z-score.
- 🎯 P-values can be interpreted as probabilities or proportions of all possible values beyond a certain point.
- 📈 The Z table provides the proportion of observations to the right of a given Z-score across a standard normal distribution.
- 🔍 To find a p-value, locate the Z-score in the table by matching the first two digits in the left column and the third digit in the top row.
- 🌐 The Z table is symmetrical, meaning the p-value for Z and -Z is the same, reflecting the properties of a normal distribution.
- 🔑 The p-value at Z = 1.23 is given as 0.1093, indicating 10.93% of observations are to the right of this Z-score.
- 📚 The table is used by looking up a specific Z-score to determine the proportion of data that falls beyond it.
- 📉 The concept of p-values is crucial for understanding statistical significance in hypothesis testing.
- 📝 Remembering the structure of the Z table is essential for correctly interpreting and using p-values in statistical analysis.
- 📉 Understanding p-values helps in determining the likelihood of observing a particular result under the null hypothesis.
Q & A
What are the two sections of the Z table?
-The Z table consists of a graph or chart at the top and a table at the bottom. The graph represents the distribution, while the table provides numerical values related to Z-scores.
What is a p-value in the context of the Z table?
-A p-value is the proportion of observations that are to the right of a specific Z-score. It can be thought of as a probability or a proportion of all possible values.
How can you interpret a p-value?
-A p-value can be interpreted in two ways: as the probability that a randomly selected observation will fall in a certain range, or as the proportion of all observations that fall beyond a specific point.
Where do the p-values in the Z table come from?
-The p-values come from the Z table itself, which provides the proportion of observations to the right of each possible Z-score across the distribution.
How is the Z distribution symmetrical as mentioned in the script?
-The Z distribution is symmetrical because for every positive Z-score, there is a corresponding negative Z-score with the same p-value. For example, Z = 1.23 and Z = -1.23 both have the same p-value.
How do you find the p-value for a specific Z-score using the Z table?
-To find the p-value for a specific Z-score, look up the first two digits of the Z-score in the left column and the third digit in the top row of the table to find the corresponding p-value.
What does the gray area in the script represent?
-The gray area represents the range of observations that are to the right of a specific Z-score, which corresponds to the p-value for that Z-score.
What is the p-value for Z = 1.23 according to the script?
-The p-value for Z = 1.23 is 0.1093, which means 10.93% of observations are to the right of Z = 1.23 in the distribution.
Why is it important to understand the Z table?
-Understanding the Z table is important for statistical analysis, as it helps in determining the probability or proportion of observations beyond a certain point, which is crucial for hypothesis testing and data interpretation.
Can the Z table be used for both positive and negative Z-scores?
-Yes, the Z table can be used for both positive and negative Z-scores due to the symmetry of the distribution, with the p-value being the same for Z and -Z.
What is the significance of the Z-score of 0 in the distribution?
-A Z-score of 0 represents the mean of the distribution. Half of the data lies above this point, and the other half lies below it, making it a central reference point in the distribution.
Outlines
📊 Understanding the Z Table and P Values
This paragraph explains the structure and usage of the Z table in statistics. It consists of a graphical representation and a numerical table. The table provides possible p-values, which are the proportions of observations to the right of specific Z-scores. A p-value can be interpreted as the probability of selecting a random Z value that falls within a certain range or as the proportion of all possible values that exceed a specific point. The Z table is used to find the p-value for a given Z-score by locating the first two digits in the leftmost column and the third digit in the top row. The paragraph also emphasizes the symmetry of the Z distribution, indicating that the p-value for Z and -Z is the same.
Mindmap
Keywords
💡Z table
💡p-value
💡Z-score
💡Observations
💡Distribution
💡Graph
💡Table
💡Symmetric
💡Proportion
💡Probability
💡Mean
Highlights
Introduction to the Z table and its two main sections: a graph/chart and a table.
Explanation of p-values as the proportion of observations to the right of specific Z scores.
Interpreting p-values as both a probability and a proportion.
Description of the gray area in the graph representing the p-value.
Origin of p-values from the Z table.
Distribution of Z scores across the graph with Z equals 0 at the center.
How to find the proportion of observations to the right of a specific Z score using the table.
Method to locate Z scores in the table using the first two and third digits.
Example of looking up the p-value for Z = 1.23 and finding it to be 0.1093.
Explanation of the symmetrical nature of the Z table and p-values.
Demonstration of finding the p-value for Z = -1.23, which is the same as for Z = 1.23.
Emphasis on the importance of understanding p-values as they relate to the Z table.
Clarification that p-values are found inside the table with corresponding Z scores.
Instruction on how to use the left column and top row to find the correct p-value.
Highlighting the table's symmetry and its implications for Z scores.
Final summary of the process for using the Z table to find p-values.
Transcripts
Browse More Related Video
Normalized Table: Understand z scores, p values, critical values
How to find critical Z value (Z alpha)
P Values, z Scores, Alpha, Critical Values
How To Find The Z Score Given The Confidence Level of a Normal Distribution 2
6.1.5 Standard Normal Distribution - z scores Corresponding to Areas. Percentiles. Critical Values.
Finding P-Value for a Z-Test Using the TI-84
5.0 / 5 (0 votes)
Thanks for rating: