6.1.5 Standard Normal Distribution - z scores Corresponding to Areas. Percentiles. Critical Values.
TLDRThis video tutorial focuses on calculating z-scores from given probabilities, relating percentiles to areas under the standard normal curve, and identifying critical values. It emphasizes the importance of visualizing the problem with a bell curve, using either a table (Table A2) or Excel's NORM.S.INV function to find corresponding z-scores. The video also explains how to find the 80th percentile using a bone density test example, and clarifies the concept of critical values as z-scores that separate significant areas to the right from the rest of the distribution.
Takeaways
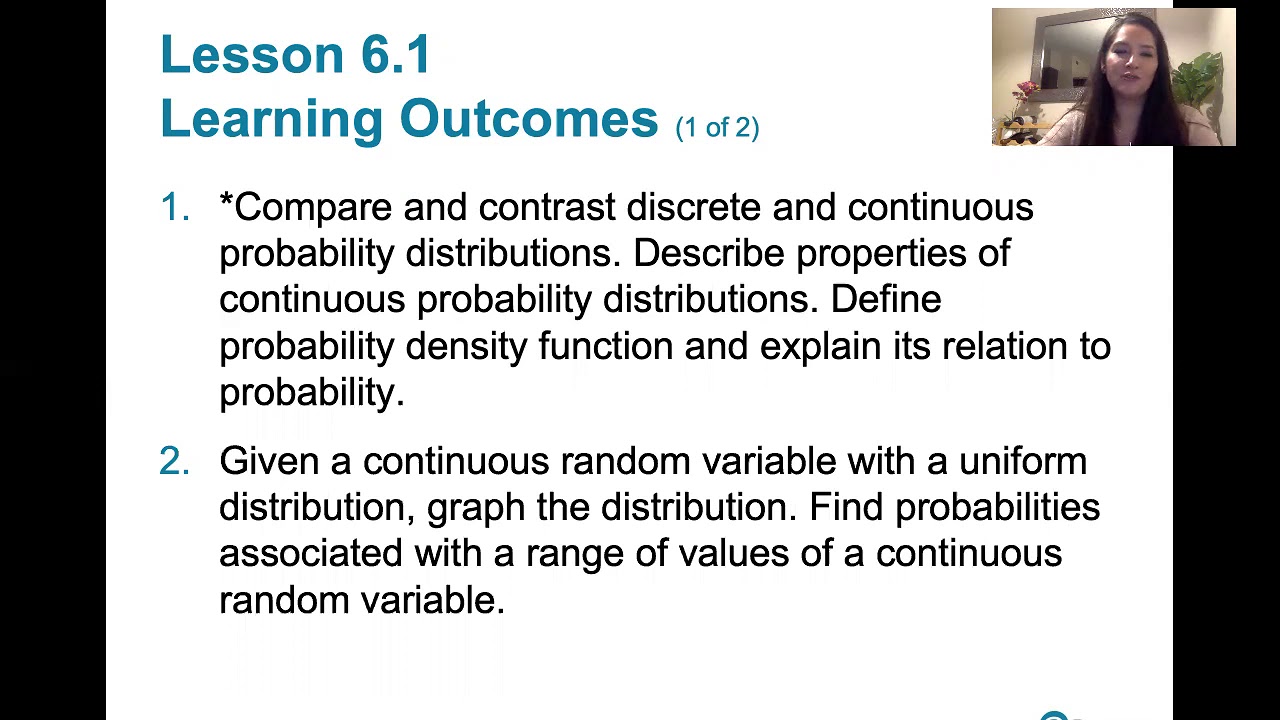
- 📚 The video script discusses the process of finding z-scores associated with known areas or probabilities, which is part of learning outcome number five from a lesson on statistics.
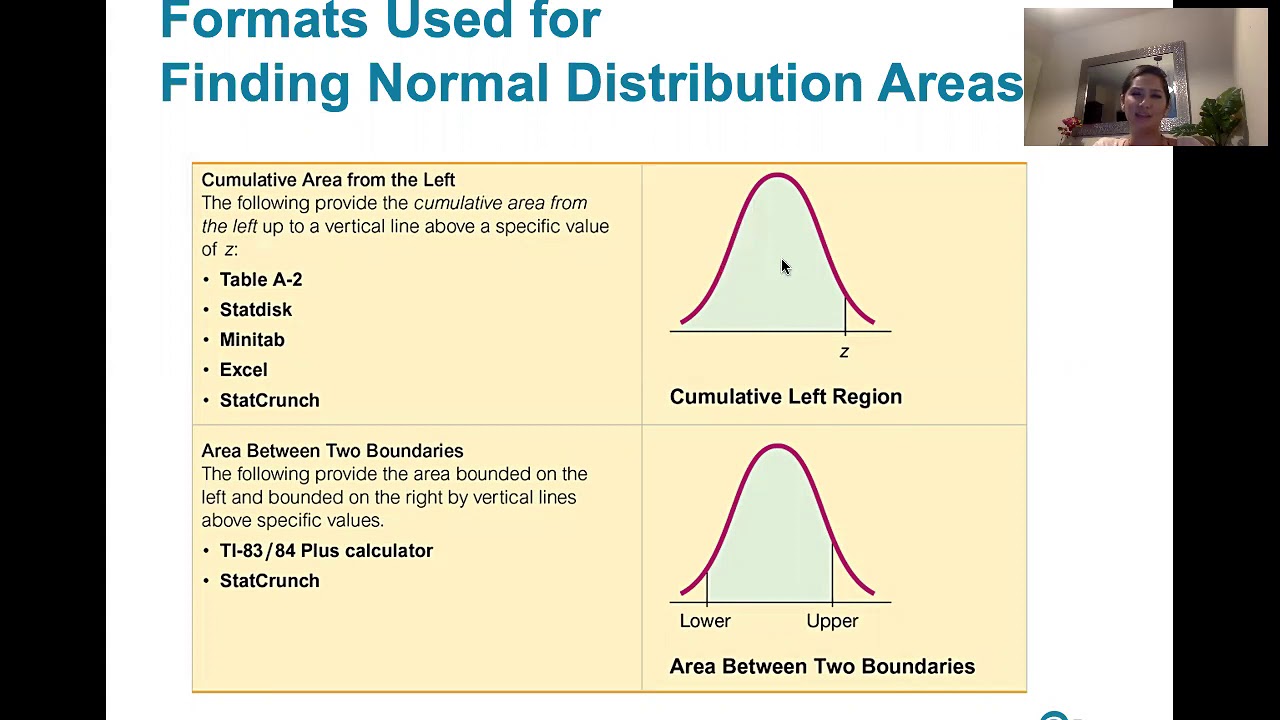
- 🔍 It emphasizes the importance of drawing a bell-shaped curve to visualize the area under the curve that corresponds to a given probability, which is crucial for understanding the relationship between areas, probabilities, and z-scores.
- 📈 The script explains how to use technology, such as Excel, to find z-scores by using the NORM.S.INV function, which is the inverse of the standard normal distribution function.
- 📝 It also mentions the use of table A2 to find corresponding z-scores during exams, as students won't have access to Excel, and encourages practice with both methods for exam preparation.
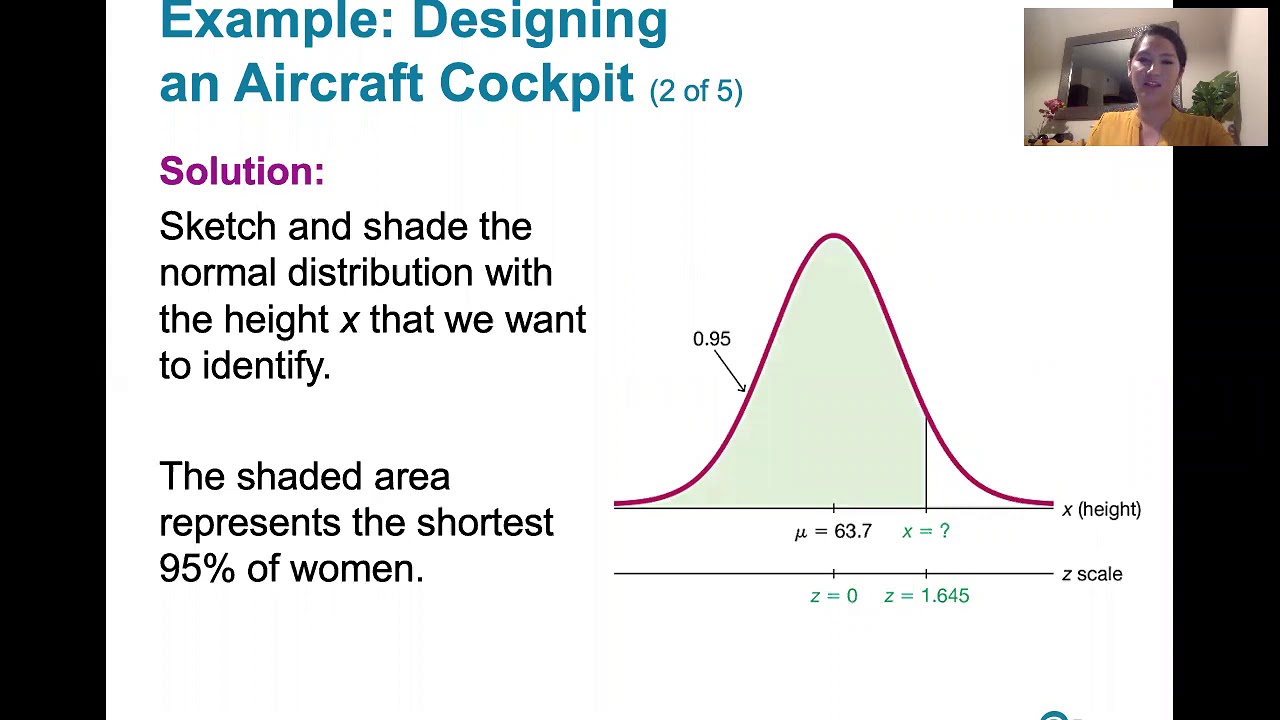
- 📊 The script provides an example of using the standard normal distribution to find the 80th percentile in bone density test scores, illustrating the process of finding the area to the left of a z-score.
- 🔢 It clarifies that percentiles correspond to areas under the curve and that finding a percentile involves identifying the z-score with a certain percentage of the area to the left.
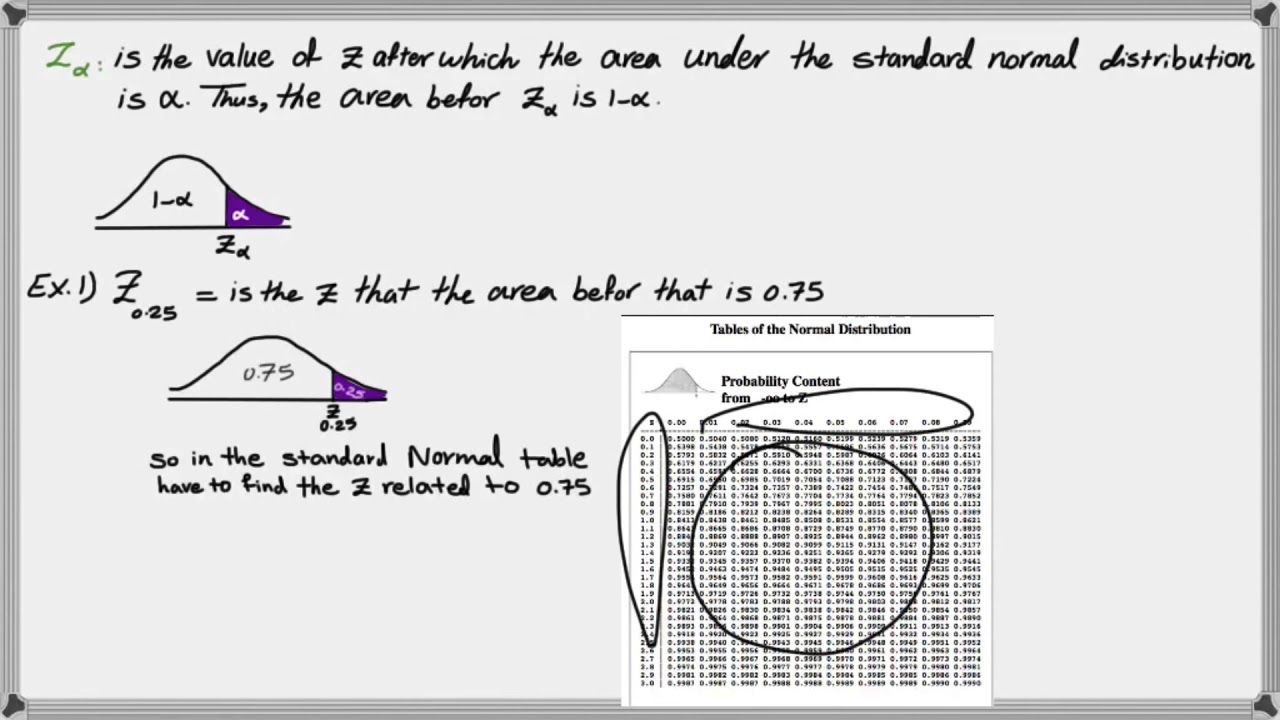
- 📉 The video explains how to find critical values for a standard normal distribution, which are z-scores that separate significantly high and low scores from the rest, using the concept of areas to the right.
- 🔄 The script points out the symmetry in the standard normal distribution, where the area to the left of a negative z-score is equal to the area to the right of a positive z-score with the same absolute value.
- 📝 It highlights the importance of accuracy when using the table or Excel functions, noting that the actual z-score may be slightly more than what is found in the table due to rounding.
- 📚 The script concludes by summarizing that whether given an area, a percentile, or a critical value, the task is to find the corresponding z-score, as these terms all imply an area under the standard normal distribution curve.
- 📘 Lastly, the script reminds viewers that areas and probabilities are equivalent when discussing the standard normal distribution, and understanding this relationship is key to solving related problems.
Q & A
What is the main topic discussed in the video?
-The main topic discussed in the video is finding z-scores associated with known areas or probabilities, relating percentiles and areas, and defining and finding critical values in the context of a standard normal distribution.
Why is it recommended to draw a picture when solving problems related to z-scores and areas?
-Drawing a picture, specifically a bell-shaped curve, helps to visualize the region under the curve that corresponds to the given probability, making it easier to understand and solve problems related to z-scores and areas.
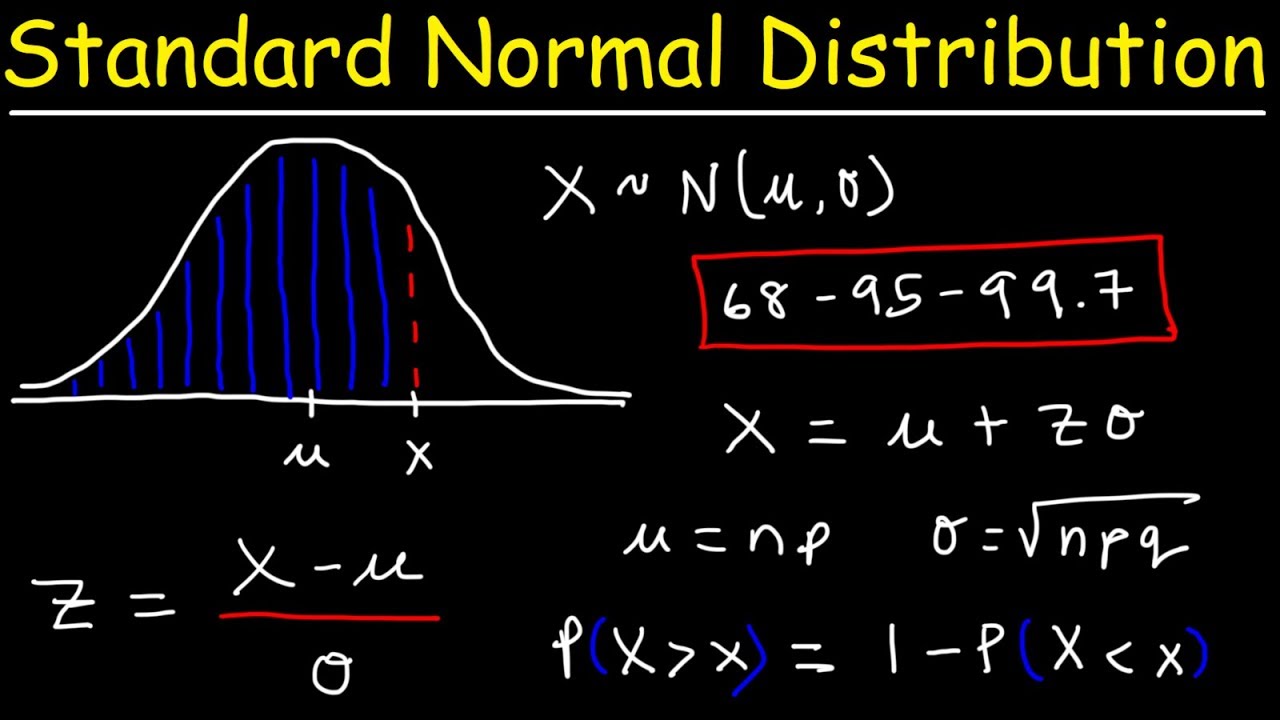
What is the standard normal distribution and why is it important in this context?
-The standard normal distribution is a normal distribution with a mean of zero and a standard deviation of one. It is important because many statistical problems, such as those involving z-scores, assume data follows this distribution.
How can one find the corresponding z-score using technology like Excel?
-In Excel, one can use the NORM.S.INV function, which is the inverse of the standard normal distribution function. By inputting the area to the left of the desired z-score, the function will return the corresponding z-score.
What is the difference between using table A2 and Excel for finding z-scores?
-Table A2 is a manual method that requires looking up areas in the table and finding the closest z-score, while Excel uses the NORM.S.INV function to calculate the z-score directly. Excel is more convenient but table A2 is useful for exams where technology is not allowed.
What is the significance of the 80th percentile in the context of bone density test scores?
-The 80th percentile in bone density test scores represents the bone density result that separates the bottom 80% of scores from the top 20%. It helps identify individuals with bone density higher than 80% of the population.
How can one find the z-score corresponding to the 80th percentile using table A2?
-To find the z-score for the 80th percentile using table A2, one must locate the area of 0.80 in the body of the table and identify the closest z-score value that corresponds to that area.
What is the purpose of critical values in a standard normal distribution?
-Critical values in a standard normal distribution serve to separate scores that are significantly high or significantly low from the rest of the scores. They are used in hypothesis testing to determine statistical significance.
How does the concept of symmetry apply to finding z-scores for critical values?
-Due to the symmetry of the standard normal distribution, if a positive z-score separates the top 2.5% from the bottom 97.5%, the negative of that z-score will separate the bottom 2.5% from the top 97.5%.
What is the relationship between percentiles, areas, and z-scores in the context of the video?
-Percentiles indicate the percentage of scores below a certain score, which corresponds to a specific area under the standard normal curve. The z-score associated with a percentile is the value that separates the specified area to the left and the remaining area to the right.
How can one find the z-score for a given area to the right using Excel?
-To find the z-score for a given area to the right using Excel, one should use the NORM.S.INV function and input 1 minus the area to the right, as Excel calculates the z-score for the area to the left by default.
Outlines
📚 Finding z-Scores from Probabilities
This paragraph explains how to find z-scores associated with given probabilities or areas under the standard normal distribution curve. The speaker emphasizes the importance of visualizing the problem by drawing a bell-shaped curve and identifying the region corresponding to the given probability. They then discuss two methods for finding z-scores: using technology like Excel, which involves the NORMSINV function, and using a z-table (table A2). The speaker also introduces a bone density test example to illustrate the process of finding the 80th percentile using both the table and Excel functions.
🔍 Excel Functions for Standard Normal Distribution
The speaker provides a detailed explanation of how to use Excel to find z-scores corresponding to specific areas under the standard normal distribution curve. They demonstrate the use of the NORMSINV function to find the z-score for the 80th percentile, which is the bone density result that separates the bottom 80% of scores from the top 20%. The speaker also explains how to verify the result using the NORM.DIST function, which calculates the area to the left of a given z-score, ensuring it matches the desired percentile.
📉 Determining Critical Values for Standard Normal Distribution
In this paragraph, the speaker discusses the concept of critical values in the context of the standard normal distribution. Critical values are z-scores that separate significantly high or low scores from the rest. The speaker explains that these values are associated with an area to the right of the z-score, which is typically found by subtracting the given alpha value (the area to the right) from 1. They illustrate the process using both a z-table and Excel's NORMSINV function, highlighting the importance of symmetry in the distribution and how it affects the calculation of critical values.
📊 Understanding Percentiles and Critical Values
The speaker summarizes the process for finding z-scores when given an area, percentile, or critical value. They clarify that percentiles and critical values imply an area under the standard normal distribution curve and that the task is to find the corresponding z-score for that area. The speaker advises that whether the problem provides an area directly or asks for a percentile or critical value, the approach involves identifying the area and then finding the z-score using the previously discussed methods.
📈 The Relationship Between Areas and Probabilities
The final paragraph reinforces the concept that areas and probabilities are equivalent when dealing with a standard normal distribution. The speaker reminds the viewer that whether the problem statement refers to areas or probabilities, the approach to finding the corresponding z-score remains the same. This paragraph serves as a reminder of the fundamental principles discussed throughout the video script.
Mindmap
Keywords
💡z-score
💡percentile
💡area under the curve
💡critical value
💡standard normal distribution
💡table A2
💡inverse function
💡Excel
💡bone mineral density test
💡symmetry
Highlights
The video discusses learning outcome number five from lesson 6.1, focusing on finding z-scores associated with known areas or probabilities.
The importance of drawing a bell-shaped curve to visualize the area corresponding to a given probability is emphasized.
If given an area to the right, find the corresponding area to the left by using the complement (1 - area to the right).
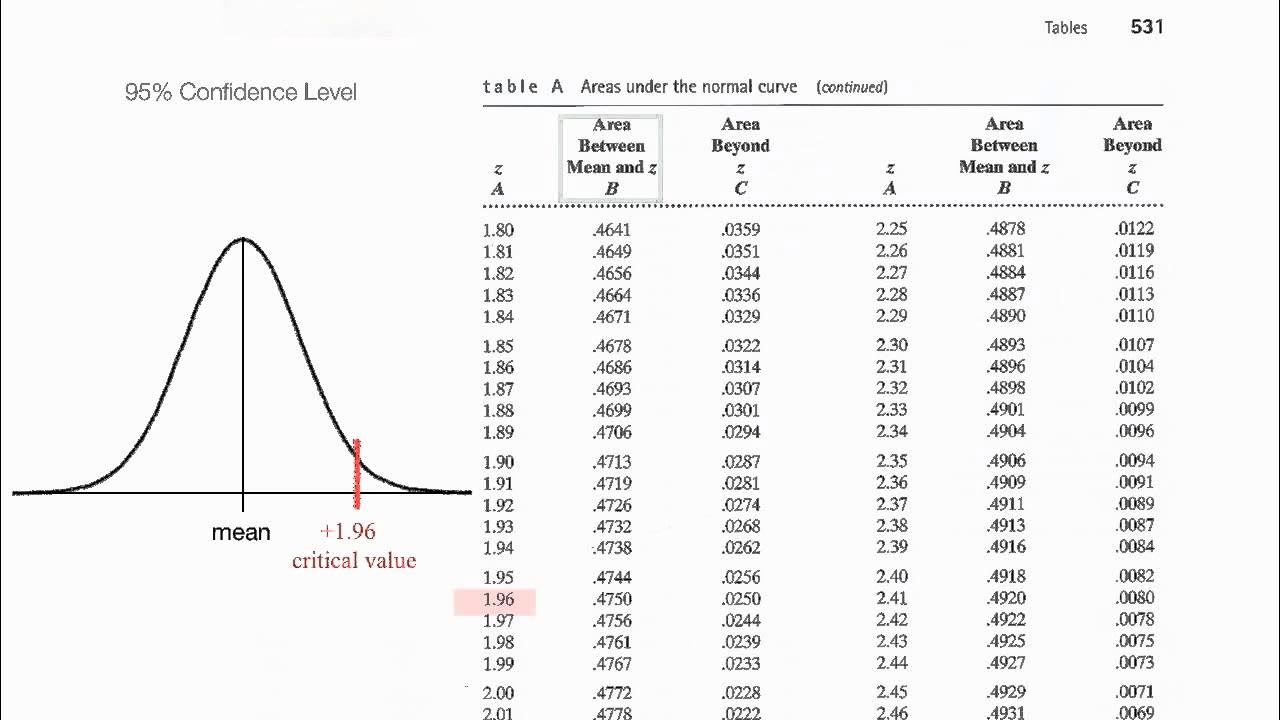
Technology and Table A2 are recommended for finding corresponding z-scores, with Table A2 being accessible during exams.
The process of finding z-scores from areas using Table A2 involves locating the closest area in the table and identifying the corresponding z-score.
Excel's NORM.S.INV function is introduced for finding z-scores, taking the area to the left as the input.
An example of a bone density test result is used to illustrate the process of finding the 80th percentile using a standard normal distribution.
The concept of percentiles is explained as corresponding to areas under the normal distribution curve.
The method of using a table to find the closest z-score to a given area is demonstrated with the 80th percentile example.
Excel is shown as an alternative method to find the z-score for the 80th percentile, yielding a precise value.
The relationship between critical values and areas to the right in a standard normal distribution is discussed.
Finding critical values involves using the complement of the area to the right (1 - Alpha) to find the area to the left.
The symmetry of the standard normal distribution is highlighted, explaining that the area to the left of a negative z-score is equal to the area to the right of a positive z-score with the same absolute value.
The video concludes with a summary of the methods for finding z-scores when given areas, percentiles, or critical values.
The importance of understanding that areas and probabilities are interchangeable when dealing with a standard normal distribution is stressed.
The video provides a comprehensive guide on using both traditional tables and modern technology to work with z-scores and areas in a normal distribution.
Transcripts
Browse More Related Video
6.1.4 The Standard Normal Distribution - Given a range of z scores, find areas or probabilities.
6.2.3 Nonstandard Normal Distributions - Given areas or probabilities, find a range of x values.
6.1.0 The Standard Normal Distribution - Lesson Overview, Learning Outcomes
How to find critical Z value (Z alpha)
Standard Normal Distribution Tables, Z Scores, Probability & Empirical Rule - Stats
Normalized Table: Understand z scores, p values, critical values
5.0 / 5 (0 votes)
Thanks for rating: