Normalized Table: Understand z scores, p values, critical values
TLDRThis video tutorial dives into the concept of normalized tables, P values, and critical values, which are essential components in statistical analysis. The video explains the layout of Z-score tables found in statistics books, highlighting the symmetry of the bell curve and how it's used to determine confidence levels. The presenter demonstrates how to find Z-scores that correspond to specific confidence levels, such as 95% and 98%, by using the table to locate the areas under the curve. The video clarifies that the process for finding negative Z-scores is the same as for positive ones, simply by looking at the left side of the mean. The tutorial encourages viewers to explore further by providing links to additional resources on critical values, P values, and Alpha levels, and to share the knowledge through social media platforms.
Takeaways
- 📚 Statistical tables often include Z-scores, which are used to determine probabilities in a normal distribution.
- 🔍 Z-scores can be both positive and negative, representing values above and below the mean, respectively.
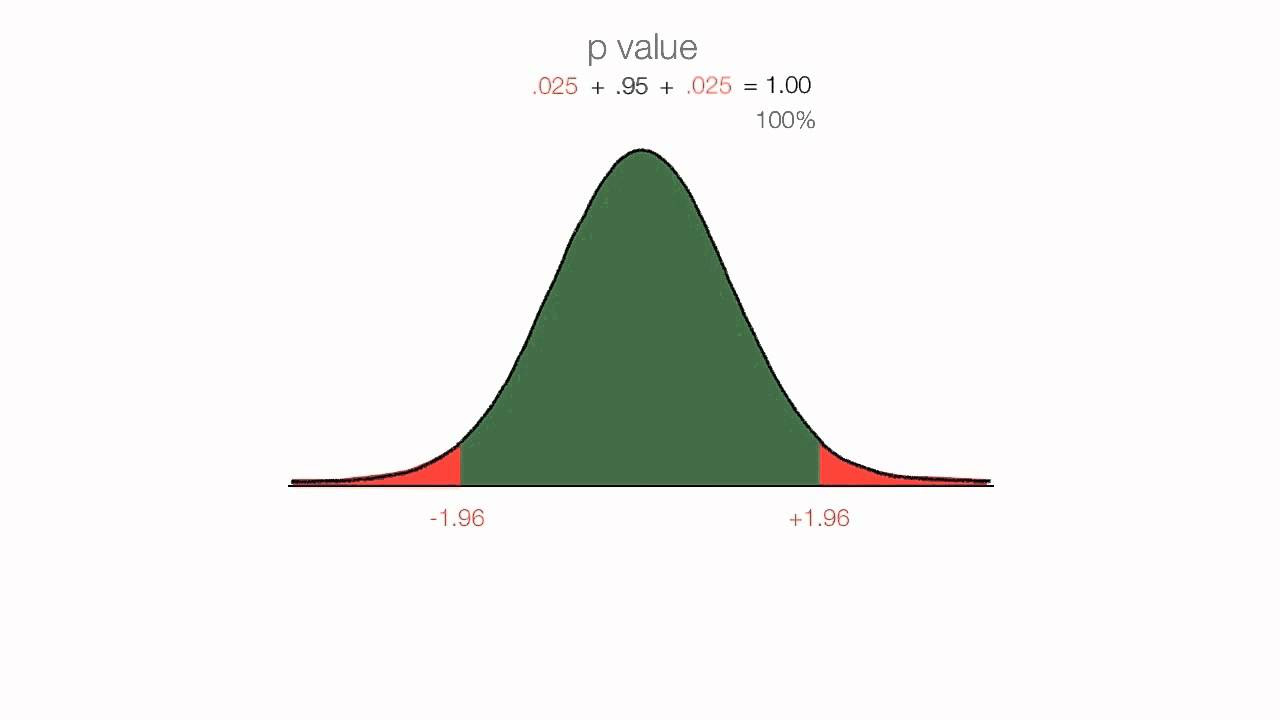
- 📊 The classic bell curve (normal distribution) has the mean in the middle, with 50% of observations above and 50% below it.
- 🟢 The body of the bell curve represents the central area where most of the data points lie, while the tails represent the extreme values.
- ⚖️ The area under the bell curve is symmetrical, with each tail representing 2.5% of the total area.
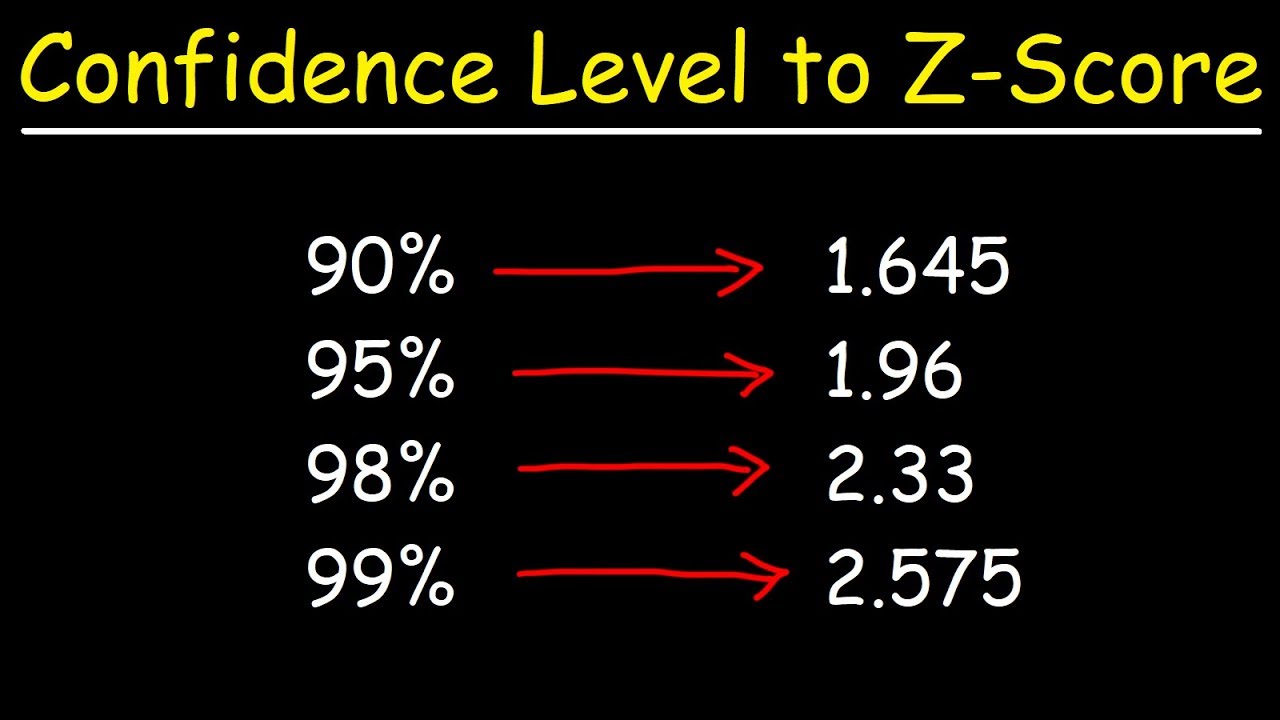
- 🔢 For a Z-score of 1.96, it corresponds to a 95% confidence level, meaning that 95% of the data lies within two Z-scores of 1.96 on either side of the mean.
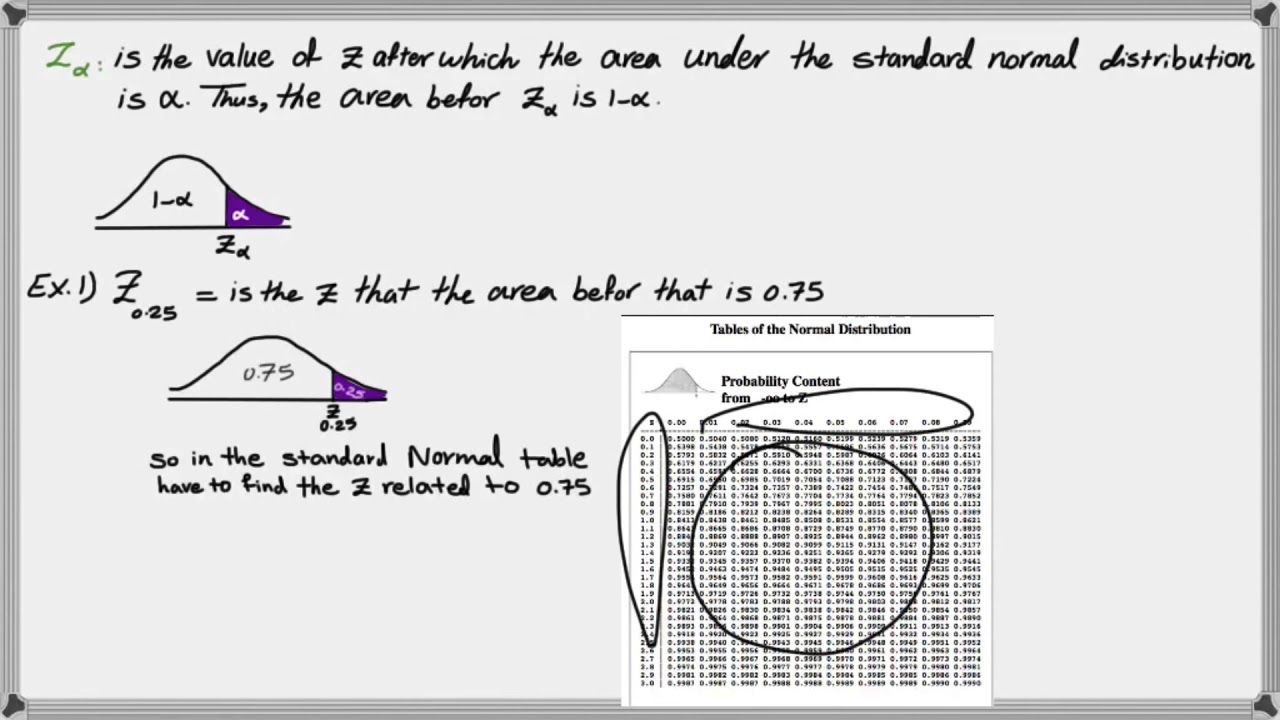
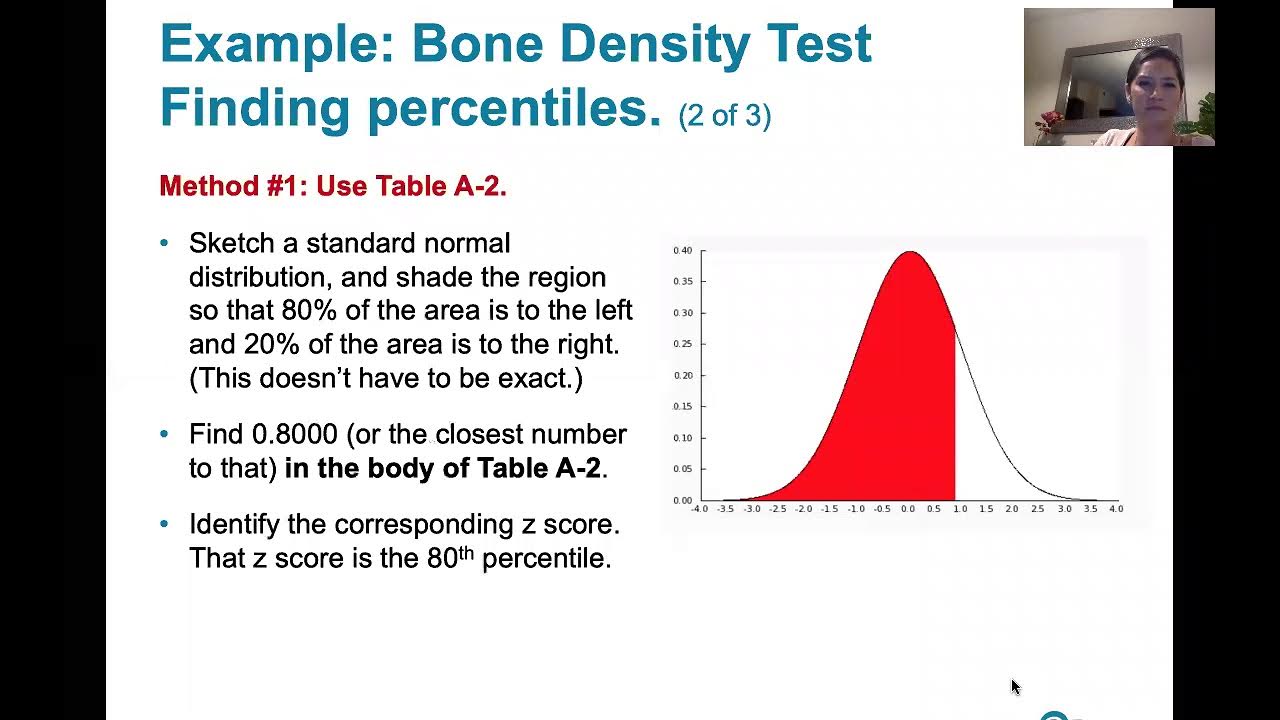
- 🔑 To find the Z-score for a given confidence level, divide the confidence percentage by two and look up the value in the table.
- 🧮 For a 98% confidence level, the critical Z-score would be approximately 2.33, as 98% divided by two equals 49%, which corresponds to the Z-score in the table.
- 🔀 Negative Z-scores are looked up in the same way as positive ones, using the symmetry of the bell curve.
- 📈 The table provided is typically only half, as it does not repeat the values for negative Z-scores, which mirror those for positive Z-scores.
- 📝 Understanding Z-scores and their relation to confidence levels is crucial for statistical analysis and hypothesis testing.
- 📱 For further understanding, watching additional videos on critical values, P-values, and Alpha levels is recommended.
Q & A
What are normalized tables found in statistics books?
-Normalized tables in statistics books contain values such as z-scores, which are used to determine probabilities associated with a normal distribution.
What is the significance of the mean in a bell curve?
-In a bell curve, the mean is the central value with 50% of the observations falling above it and 50% below it, making it the center of symmetry for the distribution.
How is the area under the bell curve distributed?
-The area under the bell curve is symmetrically distributed, with each tail (upper and lower) representing 25% of the total area, and each side (left and right) of the curve representing 50% of the area.
What is a z-score of 1.96 associated with in terms of confidence level?
-A z-score of 1.96 is associated with a 95% confidence level, meaning that 95% of the data falls within 1.96 standard deviations from the mean.
How do you find the critical value for a 98% confidence level?
-To find the critical value for a 98% confidence level, you divide 98% by two to get 49%, and then look up this value in the body of the z-table to find the corresponding z-score, which is approximately 2.33.
Why is the table for z-scores typically only half a table?
-The table is only half because z-scores can be both positive and negative, and the distribution is symmetrical. Therefore, the table only needs to list positive values, and negative values can be found by looking at the corresponding positive values on the opposite side of the mean.
How do you interpret the areas labeled as B and C in the z-table?
-In the z-table, area B represents the probability of data falling between the mean and the z-score, while area C represents the probability of data falling beyond the z-score in either tail of the distribution.
What is the sum of areas B and C for any given z-score in the table?
-The sum of areas B and C for any given z-score in the table always adds up to 0.5 or 50%, which represents the total area under the curve outside of the mean to the respective z-score.
How does the concept of symmetry apply to the bell curve and z-scores?
-The concept of symmetry in the bell curve means that the distribution is mirror-imaged across the mean. This implies that the probabilities associated with positive and negative z-scores are equal, and thus, the same row in the z-table can be used for both.
What is the purpose of a confidence level in statistical analysis?
-A confidence level in statistical analysis is a measure of how certain we can be that the true value of a population parameter lies within a specified range. It is often used in hypothesis testing to determine the reliability of the results.
How can one enhance their understanding of normalized tables, P values, and critical values?
-One can enhance their understanding of these concepts by referring to additional resources such as the video links provided, which offer further explanations on critical values, P values, and Alpha levels.
Outlines
📊 Understanding Normal Distribution and Z-Scores
This paragraph introduces the concept of normalized tables, P-values, Z-scores, and critical values, which are typically found in the back of statistics books. The presenter explains that the Z-scores are symmetrical around the mean, with 50% of the observations above and below it. The video script provides a visual representation of a bell curve, highlighting how the table is broken down into a body and tails, with equal areas on both sides. The script also discusses how to use the table to find the Z-score corresponding to a given confidence level, using 1.96 as an example for a 95% confidence level. It further explains that for a 98% confidence level, the Z-score would be 2.33. The presenter also clarifies that negative Z-scores are looked up in the same manner as positive ones, just on the opposite side of the mean.
Mindmap
Keywords
💡normalized tables
💡P values
💡Z scores
💡critical values
💡bell curve
💡mean
💡confidence level
💡symmetrical distribution
💡body and tails
💡area under the curve
💡positive and negative Z scores
Highlights
The tutorial discusses normalized tables, P values, z-scores, and critical values, which are fundamental in statistical analysis.
Z-scores are represented in the far left column of statistical tables, with two columns showing both positive and negative values.
The classic bell curve is introduced, with the mean at the center and 50% of observations above and below it.
The table is divided into a body and tails, with upper and lower tails, all symmetrical and equal areas.
The area under one side of the bell curve is equal to 0.5, representing 50% of the data distribution.
Z-scores are used to find the area between the mean and the z-score, which is labeled as 'B' in the table.
The sum of areas 'B' and 'Z' in the table always equals 0.5, regardless of the z-score's position.
The tutorial explains how the z-score of 1.96 corresponds to a 95% confidence level.
The calculation method for deriving the z-score from a given confidence level is demonstrated.
For a 98% confidence level, the critical z-score is shown to be approximately 2.33.
The video provides additional resources for understanding critical values, P values, and Alpha.
The tutorial clarifies that negative z-scores are looked up in the same way as positive ones, using the left side of the mean.
The areas 'B' and 'C' for negative z-scores are the same as for positive ones, using the same row for lookup.
The video encourages viewers to share the knowledge and subscribe for more informative content.
Links to other related videos are provided for further learning on statistics and related concepts.
The tutorial emphasizes the importance of understanding statistical tables for students and practitioners in the field.
The presenter wishes good luck to viewers in their classes, indicating the educational value of the content.
Transcripts
Browse More Related Video
How To Find The Z Score Given The Confidence Level of a Normal Distribution 2
P Values, z Scores, Alpha, Critical Values

Critical values for Confidence Intervals

How to Use the Z Table
How to find critical Z value (Z alpha)
6.1.5 Standard Normal Distribution - z scores Corresponding to Areas. Percentiles. Critical Values.
5.0 / 5 (0 votes)
Thanks for rating: