Unit II: Lec 7 | MIT Calculus Revisited: Single Variable Calculus
TLDRThe video lecture delves into the art of curve plotting, contrasting pre-calculus and calculus approaches. It emphasizes the utility of calculus in plotting curves accurately, using 'y = x squared' as an example to illustrate the significance of derivatives in determining a curve's rise and fall. The lecture further explores even and odd functions, stationary points, and points of inflection, demonstrating how higher-order derivatives provide deeper insights into curve characteristics, ultimately enhancing curve sketching beyond basic plotting.
Takeaways
- 📚 The lecture introduces the concept of curve plotting, emphasizing the utility of calculus in enhancing traditional plotting techniques.
- 📈 The script explains how the graph of 'y = x squared' can be sketched using pre-calculus methods, such as plotting points and using symmetry.
- 🔍 It highlights the importance of understanding the mathematical properties of functions, like even and odd functions, for accurate curve sketching.
- 📉 The video clarifies that while pre-calculus methods can provide a basic sketch, calculus offers a more precise and comprehensive understanding of a curve's behavior.
- 📶 The first derivative 'dy/dx' is used to determine the slope of the curve, indicating whether the curve is rising or falling for given values of 'x'.
- 💧 The second derivative is likened to 'holding water' or 'spilling water', indicating whether the curve is accelerating or decelerating.
- 🔺 Stationary points, where the first derivative is zero, are identified as potential high or low points on a curve, crucial for understanding its shape.
- 🔄 Points of inflection, where the curve changes concavity, are associated with the second derivative being zero, but their presence requires careful analysis.
- 📐 The script uses the example of 'y = x to the fourth' to illustrate that a zero second derivative does not necessarily indicate a point of inflection.
- 🤔 It challenges common misconceptions by showing that curves with higher exponents have different behaviors near 'x = 0' and beyond 'x = 1', affecting their tangency to the x-axis.
- 🔑 The importance of higher-order derivatives in curve plotting is underscored, suggesting they provide additional insights beyond the scope of basic physics applications.
Q & A
What is the main topic of the lecture?
-The main topic of the lecture is curve plotting, with an emphasis on the use of calculus, particularly differentiation, as a tool for plotting curves more accurately.
Why does the lecturer refer to the approach before calculus as 'curve plotting' rather than 'curve sketching'?
-The lecturer refers to it as 'curve plotting' because the pre-calculus approach involves finding specific points and then sketching a smooth curve through these points, which is more about plotting individual points rather than sketching the entire curve based on mathematical analysis.
What is the significance of the curve 'y = x squared' in the lecture?
-The curve 'y = x squared' is used as a straightforward example to illustrate the concepts of curve plotting and the mathematical implications of symmetry and the properties of even functions without getting bogged down by complex computations.
What is an 'even function' in the context of the lecture?
-An 'even function' is a function where 'f(x)' equals 'f(-x)', resulting in a graph that is symmetric with respect to the y-axis.
What is an 'odd function' and how does its graph differ from that of an even function?
-An 'odd function' is a function where 'f(x)' is the negative of 'f(-x)'. The graph of an odd function has symmetry with respect to the origin, meaning that for every point (x, y) on the graph, the point (-x, -y) is also on the graph.
How does the lecturer use the properties of even and odd functions to rule out incorrect curve sketches?
-The lecturer uses the properties of even and odd functions to determine that certain curve sketches are incorrect because they do not exhibit the required symmetry with respect to the y-axis or the origin, as appropriate for the function being discussed.
What is the role of the first derivative in curve plotting?
-The first derivative, which represents the slope of the tangent to the curve at a point, helps determine whether the curve is rising or falling at any given point. It provides information about the direction of the curve's movement, which can be used to verify the accuracy of a curve sketch.
What does the second derivative represent and how is it used in curve plotting?
-The second derivative represents the rate of change of the first derivative, or the acceleration of the function. A positive second derivative indicates that the curve is 'holding water' (accelerating), while a negative second derivative indicates 'spilling water' (decelerating). This information helps refine the curve sketch by indicating whether the curve is concave up or down.
What are 'stationary points' and why are they important in curve plotting?
-Stationary points are points on a curve where the first derivative is zero, meaning the curve is neither rising nor falling at those points. They are important in curve plotting because they often represent maximum or minimum points on the curve, which are crucial for understanding the curve's behavior.
What is the significance of 'points of inflection' in the context of the lecture?
-Points of inflection are points on a curve where the concavity of the curve changes. They are significant because they indicate a change in the curve's behavior from 'holding water' to 'spilling water' or vice versa, which can be determined by the second derivative being zero at those points.
How does the lecturer relate the concept of curve plotting to physical interpretations, such as the motion of a freely falling body?
-The lecturer uses the example of a freely falling body to illustrate the concept of stationary points, explaining that the maximum height of the body is reached when its velocity (the first derivative of displacement) is zero. This physical interpretation helps to understand the significance of stationary points in curve plotting.
What is the importance of higher-order derivatives in curve plotting, as mentioned in the lecture?
-Higher-order derivatives provide additional information about the curve's behavior beyond just the slope and concavity. They can indicate more complex features of the curve, such as how well the curve fits a tangent line at a given point or how the curve's acceleration changes, which is crucial for a detailed understanding of the curve's shape and movement.
Outlines
📚 Introduction to Curve Plotting and Calculus
The first paragraph introduces the topic of curve plotting, emphasizing the importance of calculus, particularly differentiation, as a tool for plotting curves accurately. It contrasts the pre-calculus approach of plotting points and sketching curves with the calculus-based method that provides a more analytical understanding. The lecturer uses the example of the curve y = x^2 to illustrate the process and questions the certainty of the sketched curve without calculus knowledge.
🔍 Analyzing Symmetry and Properties of Functions
This paragraph delves into the concepts of symmetry in functions, focusing on even and odd functions. It explains how even functions, such as y = x^2, exhibit symmetry with respect to the y-axis, while odd functions, like y = x^3, display symmetry with respect to the origin. The lecturer uses the properties of these functions to critique incorrect curve sketches and highlights the mathematical reasoning behind the symmetry, including the implications of replacing 'x' with '−x' in the function's formula.
📉 Understanding Even and Odd Functions in Curve Plotting
The third paragraph continues the discussion on even and odd functions, providing a deeper mathematical explanation. It introduces the concept that any function can be decomposed into the sum of an even and an odd function, which is crucial for understanding the behavior of functions when plotting curves. The paragraph also explains how to identify even and odd functions algebraically and geometrically, reinforcing the idea that calculus can supplement pre-calculus techniques in curve plotting.
📈 The Role of Derivatives in Curve Sketching
In the fourth paragraph, the lecturer explains how calculus, specifically the use of derivatives, can enhance the curve sketching process. By analyzing the first and second derivatives of a function, one can determine not only whether the curve is rising or falling but also whether it is accelerating or decelerating. The paragraph uses the example of y = x^2 to illustrate how the first derivative indicates the curve's direction (rising or falling) and the second derivative indicates the curve's concavity ('holding water' or 'spilling water').
🔄 The Concept of Stationary Points and Inflection Points
The fifth paragraph introduces stationary points and points of inflection, which are critical for curve plotting. Stationary points, where the first derivative is zero, indicate potential high or low points on a curve, while points of inflection, associated with the second derivative, mark changes in the curve's concavity. The lecturer discusses the physical interpretation of these points, using the example of a freely falling body to explain the significance of stationary points and how they can be identified without calculus.
🤔 The Nuances of Derivatives and Curve Behavior
This paragraph explores the subtleties of using derivatives to understand curve behavior. It clarifies that while a zero first derivative often indicates a stationary point, it is not a guarantee, as the curve could be a saddle point. Similarly, a zero second derivative does not necessarily mean a point of inflection, as the curve's concavity may not change. The lecturer uses the example of y = x^4 to demonstrate that even with a zero second derivative, the curve does not change concavity and remains 'holding water'.
🌐 Higher Order Derivatives and Their Impact on Curve Plotting
The final paragraph expands on the importance of higher order derivatives in curve plotting. It challenges the notion that only the first and second derivatives are relevant by explaining that each successive derivative provides additional information about the curve's behavior. The lecturer emphasizes that in curve plotting, higher order derivatives can reveal how closely a curve fits a given line, such as the x-axis, in the vicinity of a particular point, and how the curve's steepness changes with increasing powers of 'x'.
Mindmap
Keywords
💡Curve Plotting
💡Differentiation
💡First Derivative
💡Second Derivative
💡Even Function
💡Odd Function
💡Symmetry
💡Stationary Points
💡Points of Inflection
💡Tangent Line
💡Concavity
Highlights
Curve plotting can be enhanced with calculus, particularly through differentiation.
The graph of 'y = x squared' is typically a parabola, sketched using pre-calculus methods.
Pre-calculus curve plotting involves plotting points and sketching a smooth curve through them.
The challenge in pre-calculus is verifying the accuracy of a sketched curve between plotted points.
For 'y = x squared', the curve cannot dip below the x-axis due to the nature of squaring real numbers.
Even functions, like 'y = x squared', exhibit symmetry with respect to the y-axis.
Odd functions, such as 'y = x cubed', demonstrate symmetry with respect to the origin.
Every function can be expressed as the sum of an even and an odd function.
Knowledge of the first derivative (dy/dx) helps determine where a curve is rising or falling.
The second derivative (d²y/dx²) indicates the curve's concavity, like 'holding water' or 'spilling water'.
Stationary points, where the first derivative is zero, can indicate high or low points on a curve.
Points of inflection, related to the second derivative, show where a curve changes concavity.
The physical interpretation of stationary points is exemplified by the maximum height of a projectile.
Higher-order derivatives provide additional insights into curve behavior beyond the second derivative.
Curves like 'y = x to the fourth' may have a second derivative of zero without a change in concavity.
The comparison of curves 'y = x squared', 'y = x to the fourth', and higher powers shows how the curve's shape changes with the exponent.
The importance of higher derivatives in curve plotting provides more detailed information than typically covered in physics classes.
Transcripts
Browse More Related Video

Lec 11 | MIT 18.01 Single Variable Calculus, Fall 2007

Sketching a curve | MIT 18.01SC Single Variable Calculus, Fall 2010
What Partial Derivatives Are (Hands-on Introduction) — Topic 67 of Machine Learning Foundations
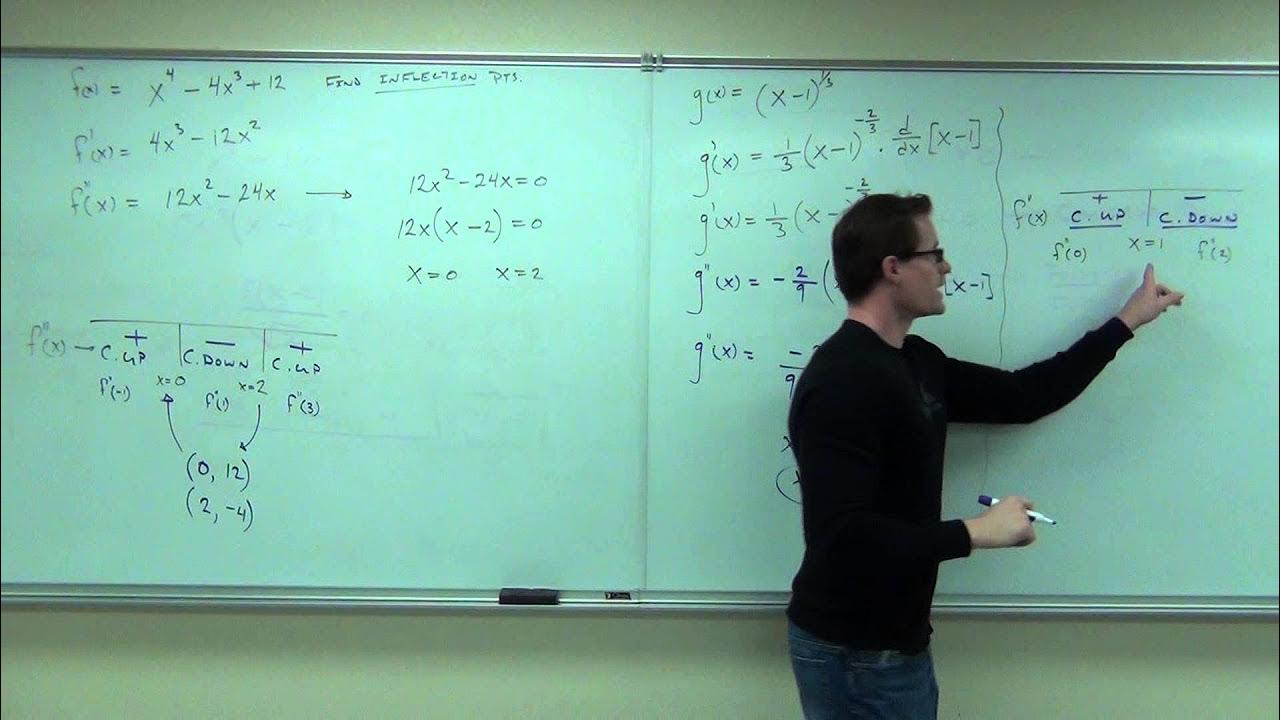
Calculus 1 Lecture 3.4: The Second Derivative Test for Concavity of Functions
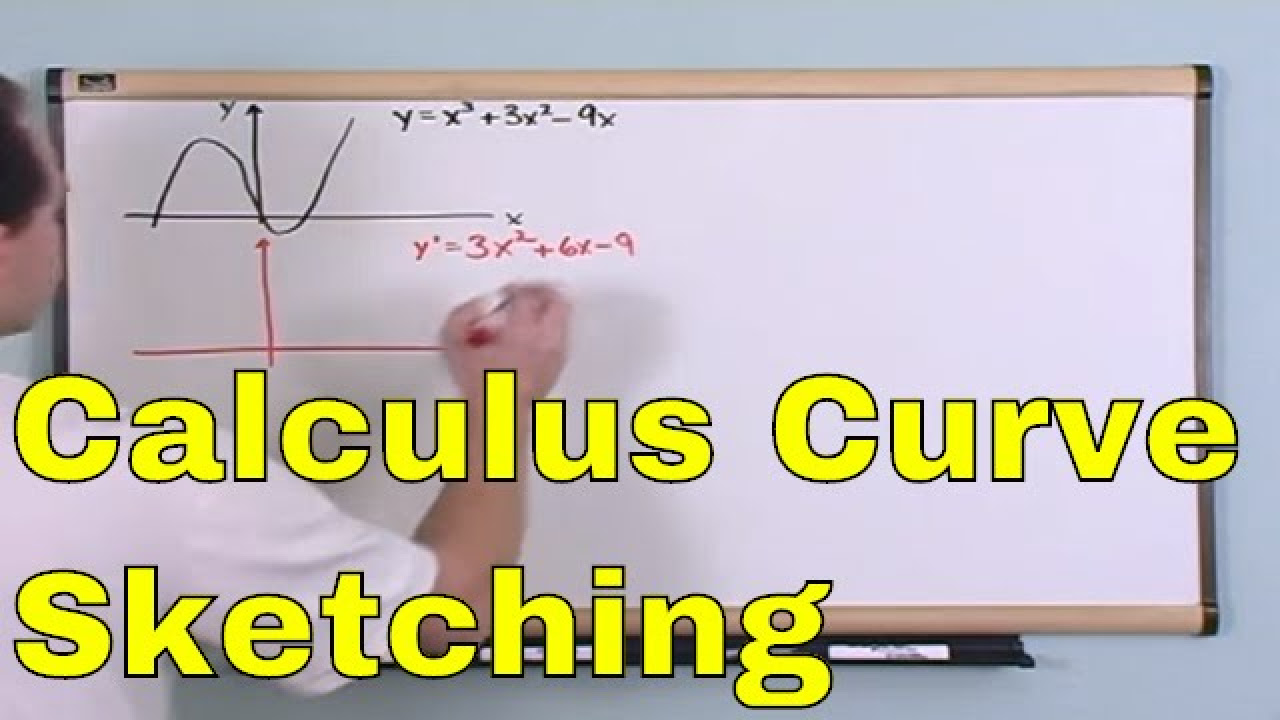
Lesson 8 - Calculus Curve Sketching Using Derivatives (Calculus 1 Tutor)
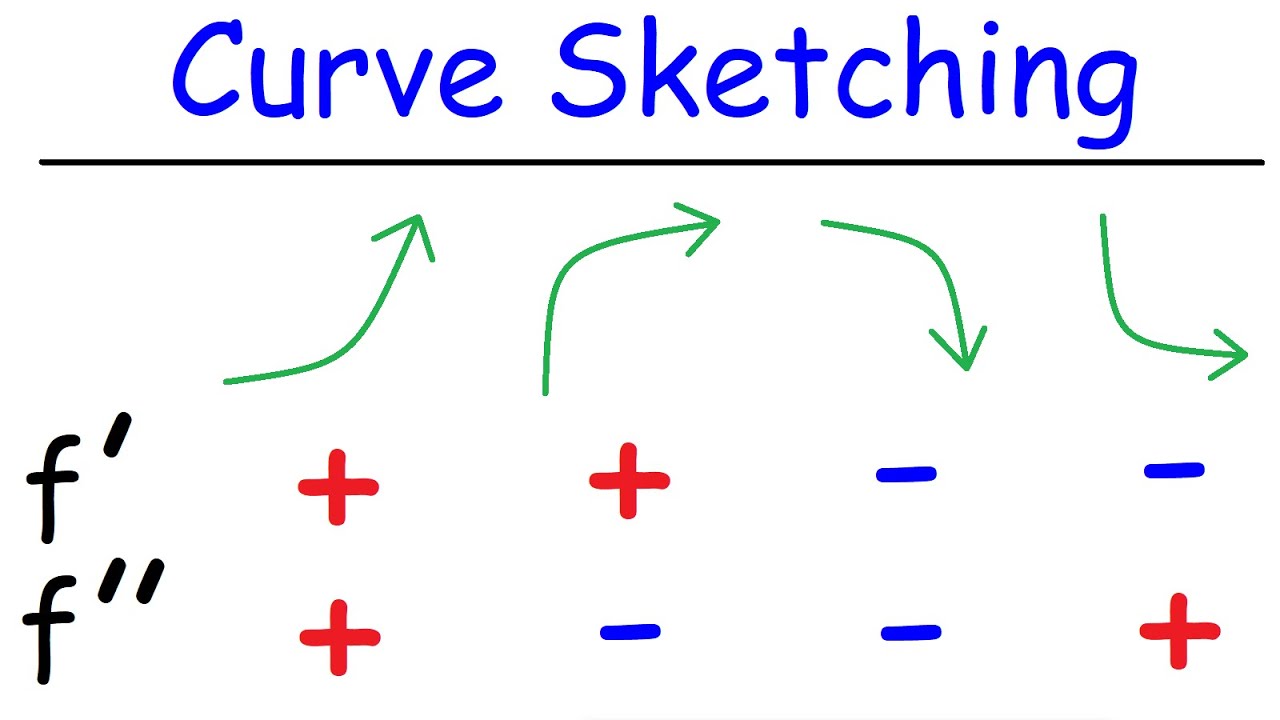
Curve Sketching - Graphing Functions Using Derivatives | Calculus
5.0 / 5 (0 votes)
Thanks for rating: