Lec 11 | MIT 18.01 Single Variable Calculus, Fall 2007
TLDRIn this lecture, the professor delves into the art of sketching functions, emphasizing the importance of understanding the function's behavior beyond just finding critical points. The discussion begins with a detailed analysis of the function f(x) = (x + 1) / (x + 2), highlighting common mistakes students make when the derivative does not equal zero. The professor then outlines a general strategy for function sketching, which includes plotting discontinuities, endpoints, and easy points before moving on to derivatives. Using f(x) = x / ln(x) as an example, the process is demonstrated, including finding vertical asymptotes, evaluating endpoints, and identifying critical points. The lecture also touches on the role of the second derivative in determining concavity and inflection points, providing a comprehensive approach to understanding and visualizing complex functions.
Takeaways
- 📚 The lecture is part of an ongoing series, with the professor acknowledging they are slightly behind schedule and aim to catch up by the following Tuesday.
- 🔍 The professor emphasizes the importance of not only focusing on calculus but also utilizing precalculus skills, such as plotting points, in sketching functions.
- 📈 The example function x + 1 / (x + 2) is used to illustrate common mistakes students make, like giving up when there are no critical points, and the correct approach to sketching it.
- 🤔 The professor encourages students to think critically, asking for suggestions on how to proceed with sketching when the derivative does not equal zero.
- 🚫 The importance of recognizing points where the function is undefined, such as x = -2 in the example, and how to approach these points by considering limits from the left and right.
- 📉 The concept of 'ends' in function sketching is introduced, referring to the behavior of the function as x approaches plus or minus infinity, and how to analyze it.
- 📌 The professor explains the significance of asymptotes in sketching, using the example function to demonstrate how to determine their behavior and incorporate them into the sketch.
- 🚫 A reminder not to ignore critical points or discontinuities in the function when determining where the function is increasing or decreasing.
- 📐 The role of the second derivative in determining the concavity of the function and identifying inflection points is discussed, with an example to illustrate its application.
- 🔢 A detailed step-by-step strategy for sketching functions is presented, including plotting discontinuities, endpoints, critical points, and analyzing the sign of the first and second derivatives.
- 📘 The transcript concludes with a preview of the next topic, maxima and minima, and a brief mention of the graphical approach to finding them, setting the stage for future lectures.
Q & A
What is the purpose of MIT OpenCourseWare and how can one support it?
-MIT OpenCourseWare aims to offer high-quality educational resources for free. Support can be provided through donations or by visiting ocw.mit.edu to view additional materials from hundreds of MIT courses.
Why did the professor skip discussing hyperbolic functions in the lecture?
-The professor skipped discussing hyperbolic functions because the class was running a bit behind schedule and planned to catch up by the following Tuesday.
What is the derivative of the function f(x) = x + 1 / (x + 2)?
-The derivative of the function f(x) = x + 1 / (x + 2) is 1 / (x + 2)^2.
Why did the professor emphasize not giving up when there are no critical points?
-The professor emphasized not giving up because even if there are no critical points, as in the case of f'(x) = 1 / (x + 2)^2 which is never equal to zero, students should still use precalculus skills to plot points and sketch the function.
What is the significance of the point x = -2 in the function f(x) = x + 1 / (x + 2)?
-The point x = -2 is significant because it is where the function is undefined, creating an asymptote in the graph. It's important to evaluate the function from both sides of this point to understand the behavior near the asymptote.
How does the professor suggest handling the function's behavior near x = -2?
-The professor suggests evaluating the function from both the left and right sides of x = -2 to determine how the function approaches negative infinity and positive infinity, respectively.
What is the role of the first and second derivatives in sketching the graph of a function?
-The first derivative helps determine the increasing or decreasing intervals of the function, indicating where the function is rising or falling. The second derivative informs about the concavity, helping to identify inflection points and the overall curvature of the graph.
Why is it incorrect to say that a function is increasing for all x if there is a break in the function?
-It is incorrect because a function can only be said to be increasing for all x if it consistently rises without any breaks or decreases. A break, such as at x = -2 in the given example, indicates a discontinuity where the function's behavior changes.
What is the general strategy for sketching a function according to the lecture?
-The general strategy includes plotting discontinuities, endpoints, and any easy points first. Then, solve for critical points and values, determine the sign of the first derivative on each interval, check the concavity using the second derivative, and finally, combine all information to sketch the graph.
What is the role of the second derivative in determining the concavity of a function?
-The second derivative, f''(x), helps in determining whether a function is concave up or concave down. If f''(x) is positive, the function is concave up, and if it's negative, the function is concave down. Points where f''(x) equals zero are potential inflection points.
Why does the professor recommend avoiding the computation of the second derivative when possible?
-The professor recommends avoiding the computation of the second derivative when possible because it can be complex and time-consuming. It's often not necessary for understanding the basic behavior of the function or for finding maxima and minima.
What is the importance of considering endpoints and points of discontinuity when finding maxima and minima of a function?
-Endpoints and points of discontinuity are important because they can be locations where the function has maximum or minimum values. These points, along with critical points, form the 'scaffolding' of the function's graph and are key to identifying extreme values.
How does the professor illustrate the process of finding maxima and minima without a detailed sketch?
-The professor illustrates that by focusing on critical points, endpoints, and points of discontinuity, one can identify potential maxima and minima without the need for a detailed sketch. This approach saves time and effort while still providing accurate results.
Outlines
📚 Introduction to Sketching Functions and MIT OCW Support
The professor begins by acknowledging the support provided under a Creative Commons license, which helps MIT OpenCourseWare offer free educational resources. Donations can be made at ocw.mit.edu. The lecture is a continuation of the topic on sketching functions, with a particular focus on hyperbolic functions. The professor admits to being slightly behind schedule but aims to catch up by the following Tuesday. The lecture proceeds with an example of sketching the function f(x) = x + 1 / (x + 2), emphasizing the importance of not giving up even when the derivative does not equal zero, indicating no critical points.
🔍 Detailed Analysis of Function Behavior and Asymptotes
The professor elaborates on the function from the previous lecture, discussing the importance of recognizing where the function is undefined, such as at x = -2. The behavior of the function as x approaches this value from both sides is analyzed, revealing the function tends towards negative infinity on one side and positive infinity on the other. The professor also discusses the behavior of the function at the 'ends' (as x approaches plus or minus infinity) and uses limits to show the function approaches y = 1. Asymptotes are introduced to sketch the function's graph, and the professor highlights the importance of considering the function's behavior at these critical points to avoid errors in graphing.
📈 Understanding Function Sketching and the Role of Derivatives
The professor continues with the function sketching example, addressing the concern of whether the function might dip below a certain point. A student correctly points out that since there are no critical points, the function cannot double back on itself. The professor emphasizes that the derivative being non-zero ensures the function will not backtrack. The discussion then turns to the importance of recognizing the function's behavior at discontinuities and ends, and the professor outlines a general strategy for sketching functions, which includes plotting discontinuities, endpoints, and easy points as a pre-calculus approach before considering derivatives.
📘 General Strategy for Sketching Functions and Examples
The professor outlines a general strategy for sketching functions, which includes four main steps: plotting discontinuities and endpoints, determining the sign of the first derivative to establish increasing and decreasing intervals, examining the second derivative to determine concavity and inflection points, and combining all information to sketch the function. The strategy is illustrated using the function f(x) = x / ln(x) as an example. The professor emphasizes the importance of considering the function's behavior at the endpoints and discontinuities, as well as the role of the first and second derivatives in sketching the function.
🔬 Critical Points and Concavity in Function Sketching
The professor discusses the process of finding critical points and analyzing concavity in the context of function sketching. Using the function f(x) = x / ln(x), the professor demonstrates how to find where the derivative is zero and how to determine the intervals where the function is increasing or decreasing. The second derivative is introduced to analyze the function's concavity and to identify inflection points. The professor also advises against computing the second derivative unless necessary, as it can be complex and time-consuming.
📚 Sketching Functions with Vertical Asymptotes and Endpoints
The professor continues the example of sketching the function f(x) = x / ln(x), focusing on identifying vertical asymptotes and endpoints. The function's behavior as x approaches 1 from both sides and as x approaches infinity is analyzed, revealing a vertical asymptote at x = 1 and the function's behavior at the endpoints. The professor emphasizes the importance of these points in understanding the overall shape of the function's graph.
📉 Detailed Function Sketching with Critical Points and Concavity
The professor provides a detailed analysis of the function f(x) = x / ln(x), identifying critical points and analyzing the function's concavity. The derivative is computed, and the professor demonstrates how to find where the derivative is zero, leading to the identification of a critical point at x = e. The function's behavior in different intervals is discussed, and the professor uses the second derivative to analyze the function's concavity, revealing an inflection point at x = e^2.
📈 Maxima and Minima in Function Sketching
The professor concludes the lecture by discussing the graphical representation of maxima and minima in the context of function sketching. The importance of considering critical points, endpoints, and points of discontinuity when identifying extrema is emphasized. The professor also hints at the goal of finding shortcuts to determine maxima and minima without the need for extensive graph decoration or detailed sketching, setting the stage for future lectures on the topic.
Mindmap
Keywords
💡Sketching
💡Derivative
💡Critical Points
💡Asymptote
💡Concavity
💡End Behavior
💡Discontinuities
💡Maxima and Minima
💡Inflection Points
💡Quotient Rule
Highlights
Introduction to the eleventh lecture and the continuation of the topic on sketching functions.
Explanation of why hyperbolic functions were not discussed due to being behind schedule.
Demonstration of how to sketch the function f(x) = (x + 1) / (x + 2) using precalculus skills.
Discussion on the importance of plotting points where the function is undefined, specifically x = -2 in this example.
Illustration of how to evaluate the function as x approaches the point of discontinuity from both sides.
Clarification on the notation and the concept of limits when dealing with points of discontinuity.
Analysis of the function's behavior as x approaches positive and negative infinity.
Introduction of asymptotes and their role in sketching the function's graph.
Explanation of why the function cannot have critical points and the implications for its graph.
Discussion on the importance of not ignoring points of discontinuity when analyzing a function's increase or decrease.
Introduction of a general strategy for sketching functions, emphasizing a step-by-step approach.
Application of the general strategy to the function f(x) = x / ln(x), highlighting the process of finding singularities.
Explanation of how to find the ends of the function's behavior as x approaches 0 and positive infinity.
Differentiation of the function f(x) = x / ln(x) using the quotient rule and finding the critical points.
Analysis of the first derivative's sign to determine the intervals of increase and decrease.
Introduction of the second derivative and its role in determining the function's concavity.
Identification of inflection points and the use of the second derivative to refine the function's graph.
Final sketch of the function f(x) = x / ln(x) incorporating all the analyzed features.
Discussion on the importance of considering both the first and second derivatives when sketching functions.
Introduction to the topic of maxima and minima, and the graphical representation of these problems.
Emphasis on the importance of critical points, end points, and points of discontinuity in finding maxima and minima.
Transcripts
Browse More Related Video
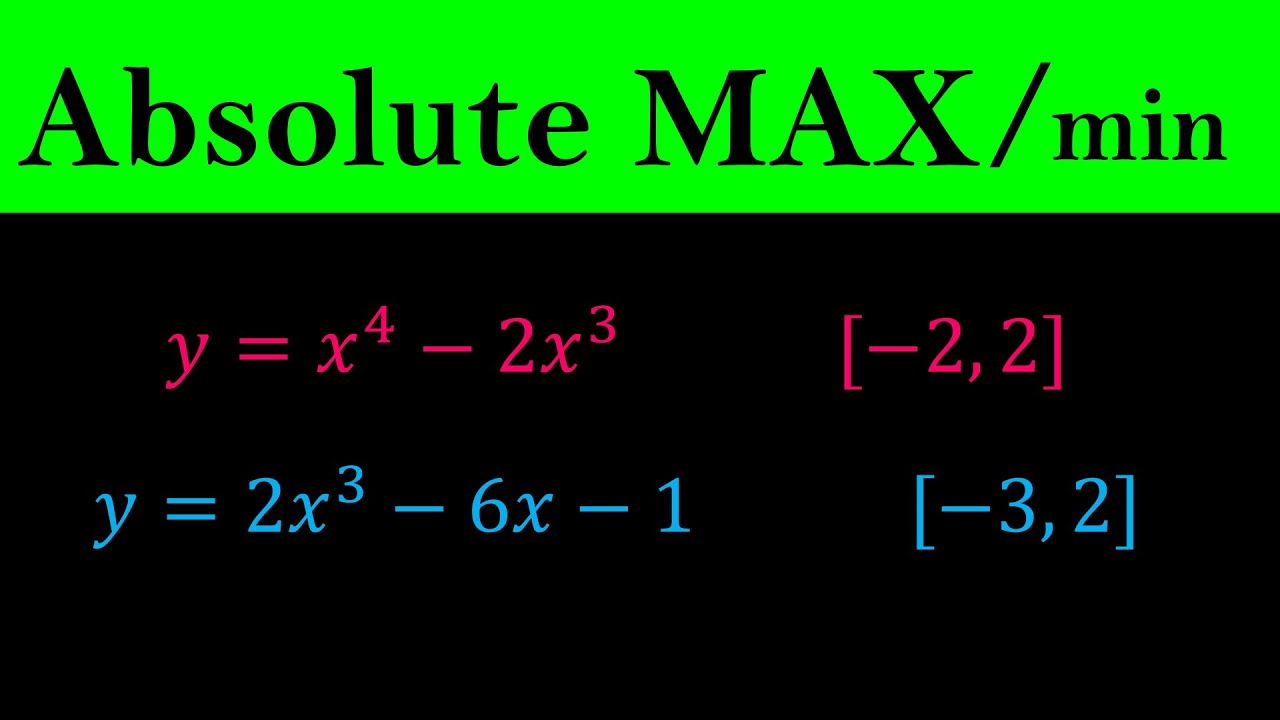
Absolute Maximum and Minimum Values - Finding absolute MAX & MIN of Functions - Calculus
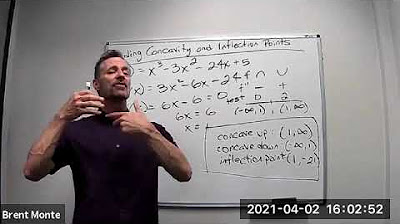
Finding Concavity and Inflection Points

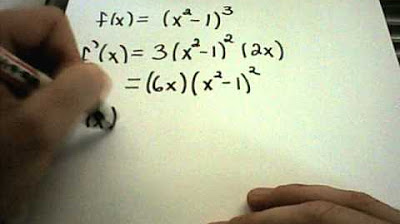
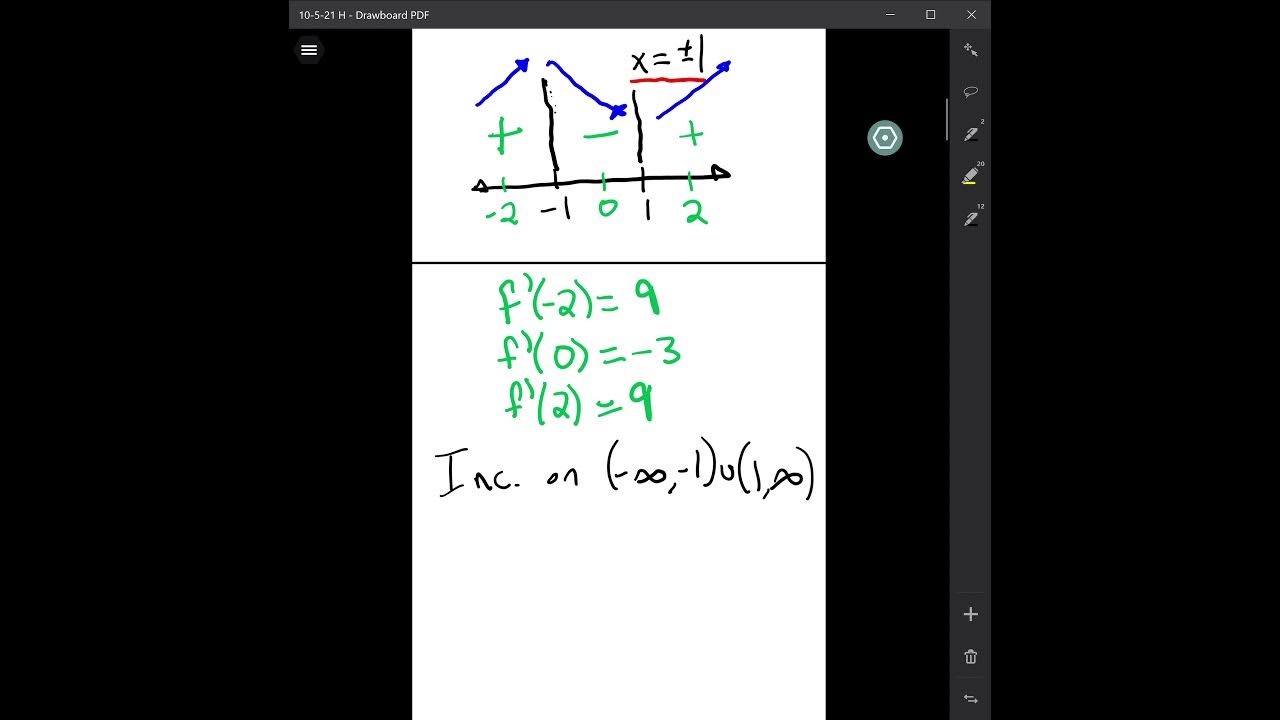
Calculus I: Finding Intervals of Concavity and Inflection point
Increasing/Decreasing + Local Max and Mins using First Derivative Test
Relative Maxima/Minima Examples
Another example graphing with derivatives | Differential Calculus | Khan Academy
5.0 / 5 (0 votes)
Thanks for rating: