Lesson 8 - Calculus Curve Sketching Using Derivatives (Calculus 1 Tutor)
TLDRThis transcript discusses the concept of curve sketching in calculus, emphasizing the use of derivatives to understand the shape of a curve without needing to plot every point. The讲师 demonstrates this by sketching a graph of y = x^3 + 3x^2 - 9x and its derivative y' = 3x^2 + 6x - 9, highlighting how the derivative reveals key features of the curve such as maxima, minima, and inflection points, thus providing a more efficient method for curve sketching.
Takeaways
- 📈 The section discusses curve sketching using knowledge from calculus, particularly derivatives.
- 🔢 Students learn to take derivatives and apply them in related rates, which is an extension of derivative concepts.
- 🖌️ With modern technology, graphing curves is simplified, but understanding the principles is still valuable.
- 📑 The task involves sketching a curve from an equation without needing to plot every point.
- 🧠 Understanding derivatives helps in estimating the shape of a curve without exact plotting.
- 📈 The example provided is y = x^3 + x^2 + x, which is a cubic function.
- 📊 The derivative of the given function, y' = 3x^2 + 2x - 9, reveals the curve's behavior.
- 🔄 The derivative graph shows where the original curve has extreme points, such as maximums and minimums.
- 🔍 By comparing the original curve and its derivative, one can deduce the shape and features of the curve.
- 📌 The script emphasizes the importance of using calculus to understand and sketch curves efficiently.
- 🎓 The best way to learn curve sketching is through examples, as demonstrated in the script.
Q & A
What is the main topic discussed in this section of the course?
-The main topic discussed in this section is curve sketching using knowledge of derivatives from calculus.
Why is curve sketching important even with the availability of computers and calculators?
-Curve sketching is important because it helps in understanding the behavior of functions and their graphical representations, which is essential for analyzing and solving problems in calculus.
What is the equation given as an example for curve sketching?
-The equation given as an example for curve sketching is y = x^3 + x^2 + x.
How does one begin to sketch a curve using calculus?
-One begins to sketch a curve using calculus by understanding the meaning of derivatives and applying basic knowledge about them to get a general idea of the curve's shape without needing to plot every point.
What is the derivative of the given example equation?
-The derivative of the example equation y = x^3 + x^2 + x is y' = 3x^2 + 2x + 1.
What does the derivative tell us about the original function?
-The derivative tells us about the rate of change and the behavior of the original function, such as where it is increasing or decreasing, and where it has maximum or minimum points.
How does the shape of the derivative graph relate to the original function's graph?
-The shape of the derivative graph indicates the inflection points and the concavity of the original function's graph. Where the derivative is positive, the function is increasing, and where it is negative, the function is decreasing.
What are the key features of the graph that is being described in the script?
-The key features of the graph described are that it starts underneath, has a hump (maximum), goes through a minimum, and then rises again.
How can one use the derivative to find critical points on the original function's graph?
-One can use the derivative to find critical points by setting the derivative equal to zero and solving for x. These x-values correspond to the points where the function has a change in concavity or slope, indicating local maxima or minima.
What is the significance of the x-axis in the context of the derivative graph?
-The x-axis in the context of the derivative graph represents the points where the rate of change is zero. Above the x-axis indicates positive slope, and below the x-axis indicates negative slope.
How does the process of curve sketching help in understanding the function's behavior?
-The process of curve sketching helps in understanding the function's behavior by providing a visual representation of its key features such as maxima, minima, inflection points, and intervals of increase or decrease, which are crucial for analyzing the function's properties and solving related problems.
Outlines
📚 Introduction to Curve Sketching and Derivatives
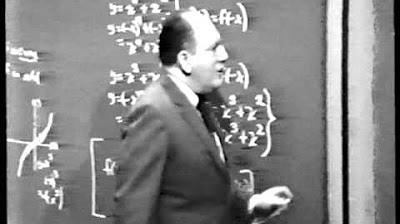
This paragraph introduces the topic of curve sketching in calculus, emphasizing the importance of understanding derivatives. It explains that while graphing curves has become easier with technology, the fundamental knowledge of how to sketch a curve using derivatives remains valuable. The speaker sets the stage for the discussion by providing an example equation (y = x^3 + x^2 + x) and suggesting that instead of plotting numerous points to form a curve, calculus principles can be applied to get a good approximation of the curve's shape. The paragraph concludes with the speaker's intention to illustrate this process through examples.
Mindmap
Keywords
💡Curve Sketching
💡Derivatives
💡Related Rates
💡X Axis
💡Y Axis
💡Maximum and Minimum
💡Critical Points
💡Tangent Line
💡Concavity
💡Asymptotes
Highlights
The course section focuses on curve sketching, a fundamental topic in calculus.
Derivatives are introduced as a key tool in understanding and sketching curves.
Related rates are discussed as an application of derivatives.
Modern tools like computers and calculators have simplified the process of graphing curves.
The main goal is to use knowledge of derivatives to get a good idea of a curve's shape without exact plotting.
An example equation, y = x^3 + x^2 + x, is provided to illustrate the curve sketching process.
Plotting a curve by hand would require a large number of points, which is time-consuming.
Calculus provides methods to sketch curves efficiently by understanding the meaning of derivatives.
The instructor plans to demonstrate the curve sketching process through examples for better understanding.
A coordinate axis is drawn to visually set up for the curve sketching example.
The curve example provided has a specific shape with a maximum, minimum, and overall upward trend.
The equation y = x^3 + 3x^2 - 9x is used to generate the example curve.
The derivative of the curve is calculated as y' = 3x^2 + 6x - 9 to analyze the curve's behavior.
The derivative graph is plotted below the original curve for comparison and analysis.
The derivative graph shows where the original curve is increasing or decreasing, providing insight into its shape.
By analyzing both the curve and its derivative, one can gather a lot of information about the curve's structure without exact plotting.
Transcripts
Browse More Related Video
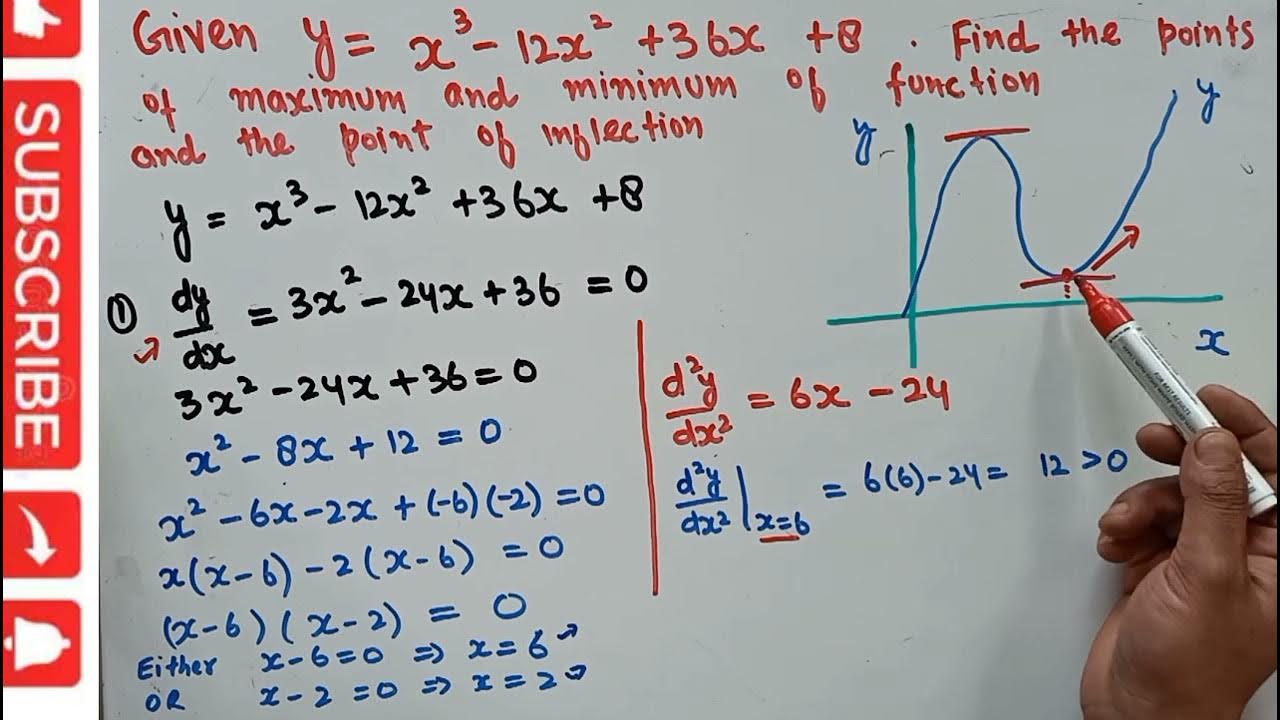
Maxima , minima and point of inflection
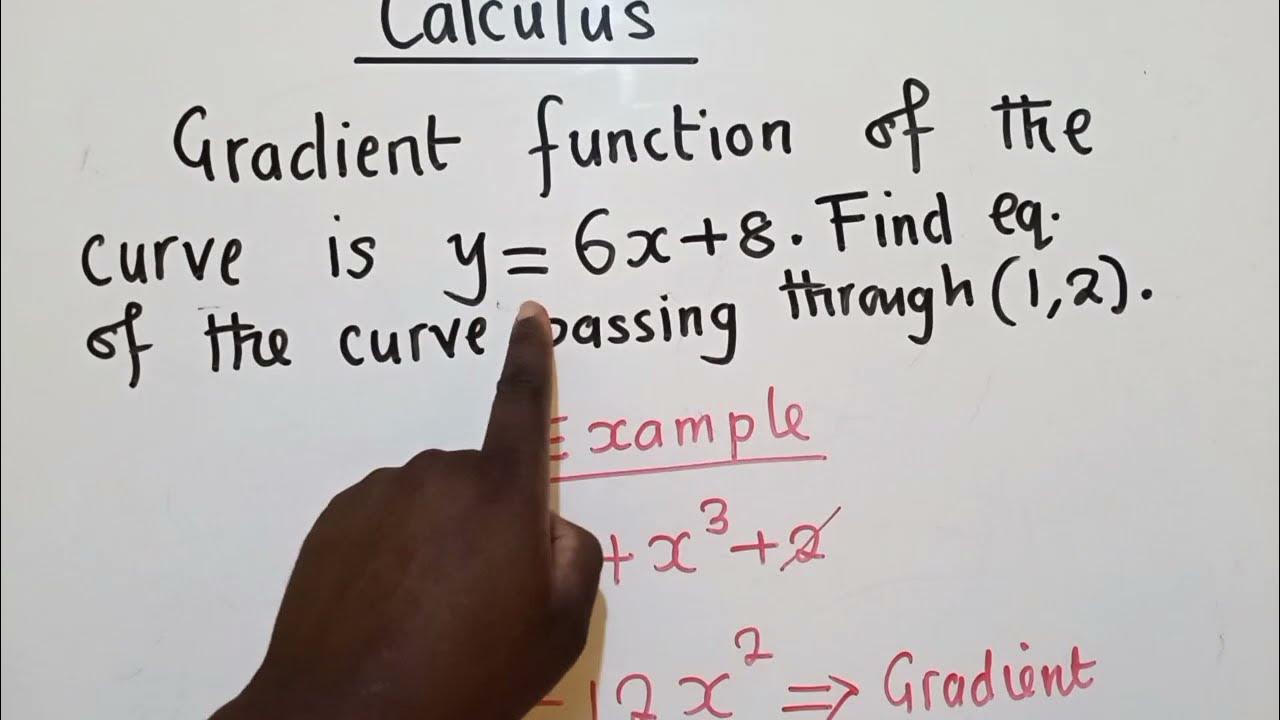
Calculus exam question

Point of Inflection - Point of Inflexion - f''(x)=0 - Definition - How to Find - Worked Example 1

Sketching a curve | MIT 18.01SC Single Variable Calculus, Fall 2010
Unit II: Lec 7 | MIT Calculus Revisited: Single Variable Calculus

Calculus I: Finding Intervals of Concavity and Inflection point
5.0 / 5 (0 votes)
Thanks for rating: