Video 1: Introduction to Simple Linear Regression
TLDRThis video introduces simple linear regression, focusing on its two main goals: establishing a relationship between two variables and forecasting new observations. It explains the concepts of positive and negative relationships, the roles of dependent (Y) and independent (X) variables, and the linear equation structure. The video uses real-world examples to illustrate how regression models can be applied, such as predicting sales growth or store profitability. It also discusses the importance of the intercept and slope in the regression equation and concludes with a practical example of modeling a family's consumption based on income.
Takeaways
- 📊 Simple linear regression is used to establish a relationship between two variables, identifying whether they move together in a positive or negative manner.
- 🔍 The first objective of regression models is to determine if there is a statistically significant relationship between variables.
- 🛍️ An example of a positive relationship is the connection between income and spending, where higher income typically leads to more spending on products.
- 💼 Another example involves testing for a potential negative relationship, such as wage differences between genders, which could indicate discrimination.
- 📚 The second objective of regression models is forecasting new observations, using known relationships to predict unobserved values.
- 📈 For instance, understanding the growth of sales over time can help predict future sales figures.
- 🏪 Regression models can also evaluate the profitability of a new store based on known factors like competition and local population.
- 📉 In regression models, the dependent variable (Y) is what we want to explain or forecast, while the independent variable (X) helps explain the variance in Y.
- 📚 The linear equation in regression models includes an intercept (beta0) and a slope (beta1), representing the relationship between X and Y.
- 📊 The slope indicates the sensitivity of Y to changes in X, showing how much Y changes for each unit change in X.
- 🤔 The intercept represents the value of Y when X is zero, which may not always have an intuitive interpretation.
- 📉 The regression line is drawn to minimize the error between the observed data points and the fitted values, representing the best fit for the data.
Q & A
What are the two main objectives of simple linear regression?
-The two main objectives are to establish if there is a relationship between two variables and to forecast new observations based on that relationship.
What is a positive relationship between two variables in the context of regression?
-A positive relationship means that when one variable increases, the other variable also tends to increase.
What is a negative relationship between two variables in the context of regression?
-A negative relationship indicates that when one variable's value increases, the other variable's value tends to decrease.
Why is it important to discuss statistically significant relationships in regression?
-Statistically significant relationships ensure that the observed relationship between variables is not due to random chance, thus providing reliable insights for analysis or prediction.
Can you provide an example of a positive relationship discussed in the script?
-An example of a positive relationship is the expectation that families with higher income will generally spend more on a given product.
What does the intercept (beta0) in a linear regression model represent?
-The intercept represents the expected value of the dependent variable (Y) when the independent variable (X) is zero.
What is the role of the slope (beta1) in a linear regression model?
-The slope indicates the rate of change of the dependent variable (Y) for a one-unit change in the independent variable (X).
How does a change in the intercept affect the linear regression line?
-A change in the intercept moves the line vertically up or down, affecting the point where the line intersects the Y-axis.
What does a change in the slope of the linear regression line signify?
-A change in the slope alters the steepness of the line, indicating how sensitive the dependent variable is to changes in the independent variable.
Why is it necessary to include an error term in the linear regression model?
-The error term accounts for the variability in the data that cannot be explained by the linear relationship, allowing the model to minimize the prediction errors.
How does the script illustrate the application of linear regression in real-world data?
-The script uses the example of predicting a family's consumption of a product based on their income, demonstrating how regression can be used to understand and forecast relationships in real data.
What does the coefficient of the income variable in the provided regression example signify?
-The coefficient of 0.85 for income indicates that for every additional unit of income, consumption is expected to increase by 0.85 units, showing the marginal effect of income on consumption.
How is the intercept of 49.13 in the example interpreted in the context of the data?
-The intercept of 49.13 suggests the baseline consumption level for a family with zero income, which may not have a practical interpretation unless considering specific circumstances like government aid.
What does the script imply about the relationship between a student's height and exam scores?
-The script implies that there should be no expected relationship between a student's height and their exam scores, and regression models can be used to test for the absence of such a relationship.
Outlines
📊 Introduction to Simple Linear Regression
This paragraph introduces the concept of simple linear regression, focusing on its two main objectives: establishing a relationship between two variables and forecasting new observations. It explains the difference between positive and negative relationships and the importance of statistical significance in these relationships. Examples given include the correlation between income and spending, wage and gender, and the non-relationship between a student's height and exam scores. The paragraph also introduces the roles of dependent (Y) and independent variables (X) in regression models and the linear equation used to represent these relationships, including the intercept (beta0) and slope (beta1).
📈 Understanding the Linear Equation and Its Components
This section delves deeper into the linear equation used in simple linear regression, explaining the significance of the intercept and slope. It uses a hypothetical linear equation (y = 4 + 2x) to illustrate how changes in the intercept affect the line's position and how changes in the slope affect the line's steepness. The paragraph clarifies that while ideal lines are straight, real-world data points will have variations, introducing the concept of error in regression analysis. It also discusses the inclusion of the error term in the regression model to account for these variations, aiming to minimize them.
🔍 Applying Regression Analysis to Real-World Data
The final paragraph applies the concepts discussed to an actual dataset, using the example of family income and consumption. It outlines the process of setting up a regression model with consumption as the dependent variable and income as the independent variable. The paragraph also presents the results from a statistical package, interpreting the coefficients (intercept and slope) in the context of the data. It concludes by visually representing the data and the fitted linear model, explaining how the regression line is drawn to minimize the error between observed and predicted values.
Mindmap
Keywords
💡Simple Linear Regression
💡Dependent Variable
💡Independent Variable
💡Coefficients
💡Intercept
💡Slope
💡Positive Relationship
💡Negative Relationship
💡Forecasting
💡Error Term
💡Marginal Effect
Highlights
Simple linear regression aims to establish if there's a relationship between two variables, specifically a positive or negative relationship.
The first objective is to determine if variables move together, such as higher income leading to higher spending.
Statistically significant relationships are sought, not just any observed patterns.
The second objective is forecasting new observations using existing relationships.
Examples include predicting sales growth or evaluating the profitability of a new store based on known variables.
Variables in regression models play different roles: dependent (Y) and independent (X).
Simple linear regression uses a linear equation where Y is a function of X, with an intercept and a slope.
The intercept (beta0) is the value of Y when X is zero, indicating the starting point of the line.
The slope (beta1) represents how much Y changes for each unit change in X.
Changing the intercept moves the line up or down, affecting where it intersects the Y-axis.
Altering the slope changes the steepness of the line, indicating the sensitivity of Y to changes in X.
Real-world data does not always form perfect straight lines; errors are present and need to be minimized.
The linear regression model includes an error term to account for the variability in the data.
An example is provided using data on family income and consumption to demonstrate how regression models can be applied.
Consumption is the dependent variable, and income is the independent variable in the example.
The model's coefficients, including the intercept and slope, are crucial for interpreting the relationship between variables.
The intercept can be interpreted as the consumption level of a family with zero income, though it may not always be intuitive.
The slope coefficient indicates the marginal effect of income on consumption, showing how much consumption increases per unit of income.
The fitted linear model is shown graphically, demonstrating how the model minimizes the error between observed and predicted values.
Transcripts
Browse More Related Video

Regression and R-Squared (2.2)
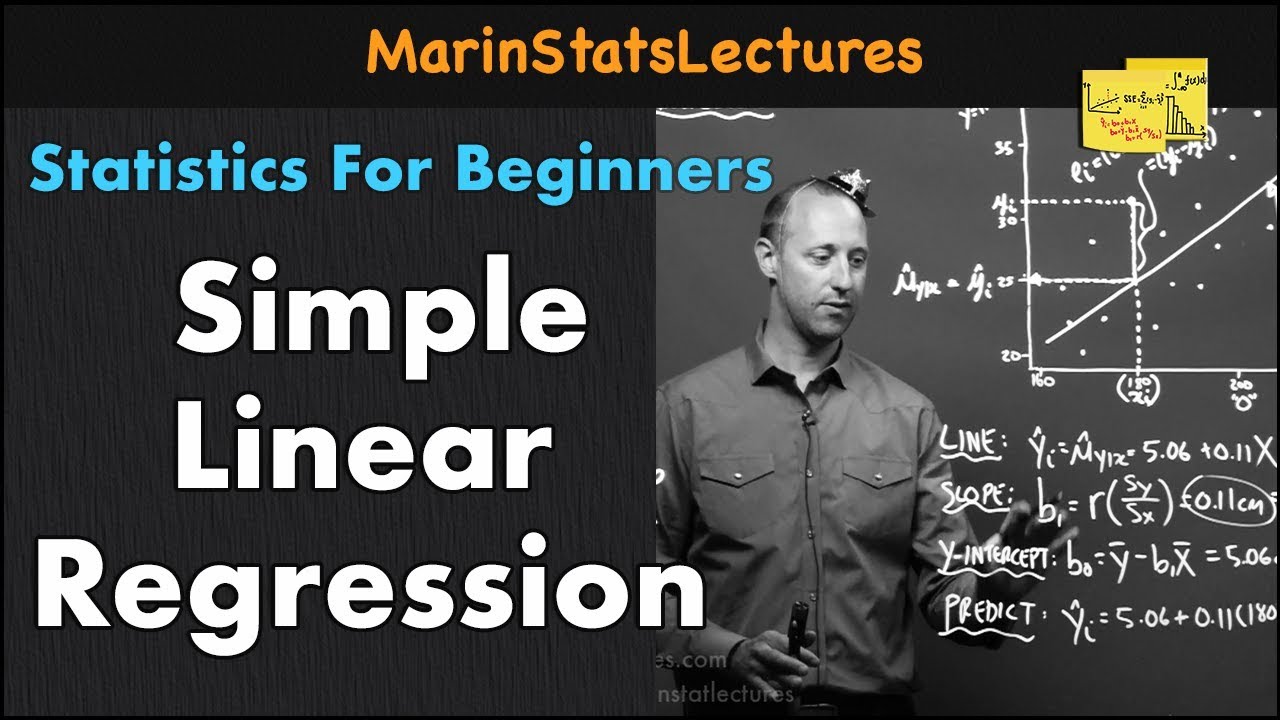
Simple Linear Regression Concept | Statistics Tutorial #32 | MarinStatsLectures
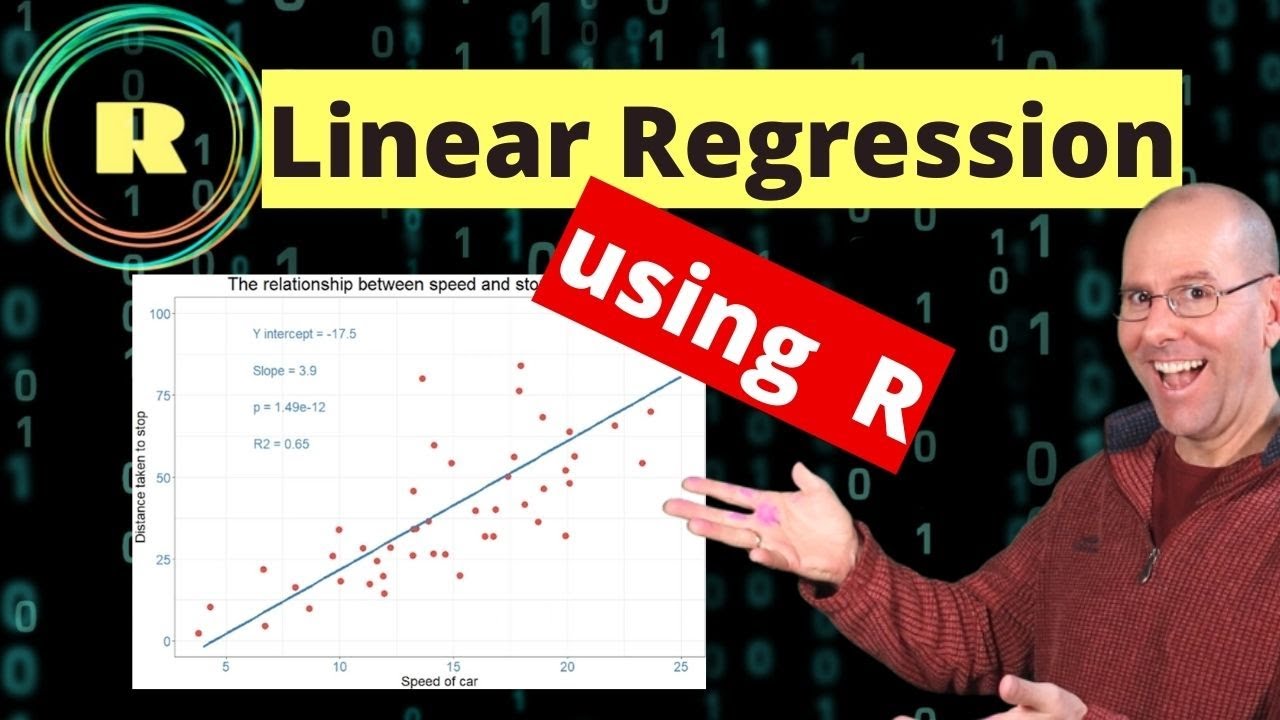
Linear regression using R programming

Elementary Stats Lesson #5
10.2.1 Regression - Essential Terminology and Background Related to Regression

Statistics 101: Multiple Linear Regression, The Very Basics 📈
5.0 / 5 (0 votes)
Thanks for rating: