10.2.1 Regression - Essential Terminology and Background Related to Regression
TLDRThe video script delves into defining essential regression terminology, distinguishing between deterministic and probabilistic models, and clarifying the concepts of explanatory versus response variables. It introduces the regression line, or line of best fit, and the regression equation, emphasizing their predictive nature. The script also explains the difference between correlation, which measures the relationship between variables, and regression, which uses this relationship to predict outcomes. The focus is on understanding when and how to use regression equations based on evidence of linear correlation.
Takeaways
- 📚 The script introduces essential terminology related to regression, including 'regression line', 'regression equation', and the distinction between deterministic and probabilistic models.
- 🔍 It clarifies that 'explanatory variable', 'predictor variable', and 'independent variable' are synonymous, as are 'response variable' and 'dependent variable'.
- 📈 The concept of 'marginal change' is defined, highlighting the difference between correlation, which measures the strength of a linear relationship, and regression, which is used to predict values based on that relationship.
- 📉 Deterministic models are those where knowing the values of the independent variables allows for the exact determination of the dependent variables, exemplified by physics equations and geometric formulas.
- 🤔 Probabilistic models, on the other hand, describe relationships where the dependent variable is not entirely determined by the independent variables, such as a child's height being influenced by but not solely determined by their parents' heights.
- 🧵 The 'regression line' or 'line of best fit' is explained as the straight line that best fits a set of data points based on the least squares property, which minimizes the sum of the squares of the vertical distances of the points from the line.
- 📝 The 'regression equation' is the mathematical representation of the regression line, predicting the value of y (denoted as y-hat for predicted values) based on a given x, with the formula y-hat = b0 + b1*x.
- 🔢 The script explains the use of different notations for sample data (b0, b1) versus population data (beta0, beta1), with Greek letters representing population parameters and Latin letters for sample statistics.
- 📊 The importance of regression analysis is underscored for predicting the value of one variable based on another, provided there is evidence of a correlation, and for quantifying the relationship between variables.
- 🔄 The script also touches on 'multiple regression', where more than one independent variable is used to predict a dependent variable, extending the basic linear regression model.
- 🔗 The relationship between correlation and regression is emphasized, with correlation indicating a linear relationship between variables and regression providing the predictive equation based on that relationship.
Q & A
What are the two main types of models discussed in the script?
-The two main types of models discussed are deterministic models and probabilistic (non-deterministic) models.
What is a deterministic model?
-A deterministic model is a model where knowing the values of the independent variables immediately gives you the values of the dependent variables without any uncertainty.
Can you provide an example of a deterministic model from the script?
-An example given in the script is the position as a function of time in physics, assuming no air resistance, where the position 'y' at time 't' is calculated using a quadratic equation involving gravity and initial conditions.
What is a probabilistic model?
-A probabilistic model is a model where the relationship between variables is not fixed and exact, but rather there is a likelihood or probability associated with the outcomes.
What is the concept of regression line or line of best fit?
-The regression line, also known as the line of best fit, is the straight line that best fits the scatter plot of data points based on the least squares property.
What is the difference between the terms 'explanatory variable' and 'response variable'?
-There is no difference; they are synonyms. The explanatory variable (also called predictor or independent variable) is used to explain or predict the response variable (also called dependent variable).
What is the purpose of a regression equation?
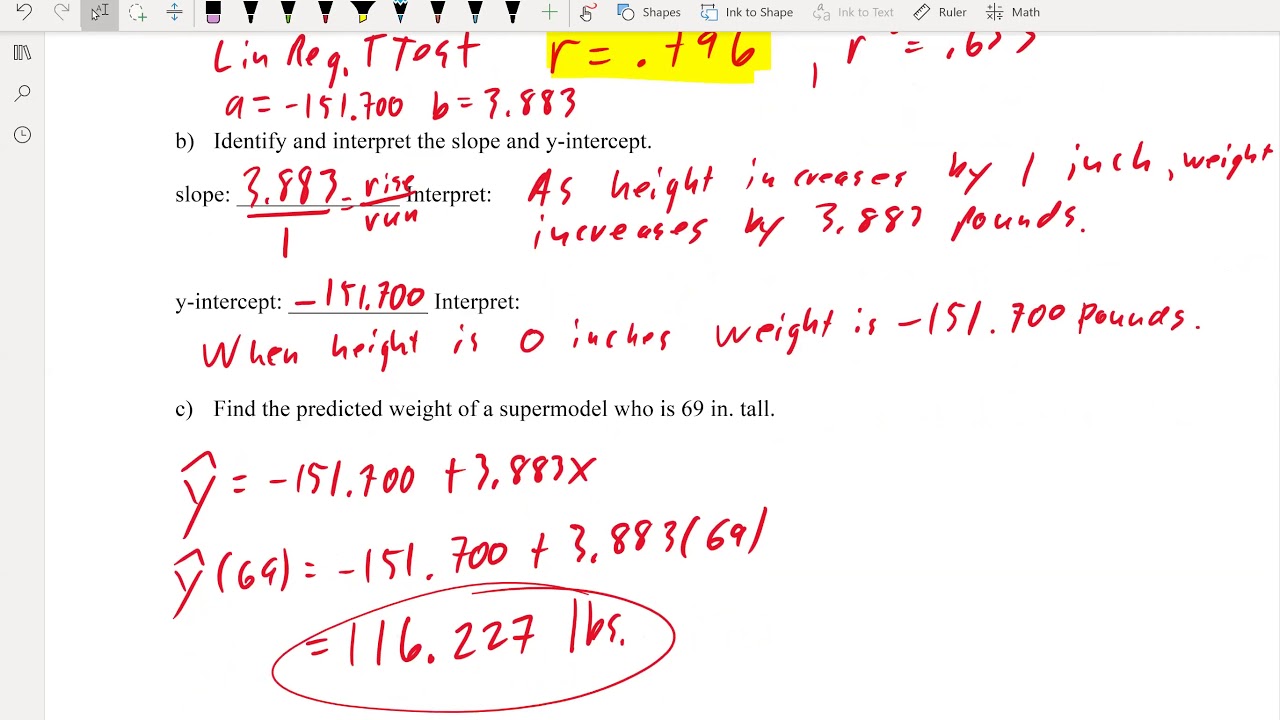
-The purpose of a regression equation is to predict the value of the dependent variable (y) based on the value of the independent variable (x), given a certain relationship between them.
What is the term 'marginal change' and how is it related to regression?
-Marginal change refers to the amount one variable changes when the other variable changes by exactly one unit. In regression, it is represented by the slope of the regression equation, indicating the change in the predicted value of y for a one-unit increase in x.
How is the concept of 'correlation' different from 'regression'?
-Correlation measures the strength and direction of a linear relationship between two variables, while regression involves finding the equation that best describes the relationship and using it to predict outcomes.
What is the significance of the 'y hat' notation in regression?
-The 'y hat' notation (ŷ) is used to represent the predicted value of y from the regression equation, as opposed to the actual y values observed in the data.
What is the relationship between the concepts of 'correlation' and 'regression' as explained in the script?
-The script explains that correlation is used to determine if there is a linear relationship between two variables, and if such evidence exists, regression can be used to predict the value of one variable based on the other.
Why is it important to differentiate between deterministic and probabilistic models?
-Differentiating between deterministic and probabilistic models is important because it helps understand the predictability and certainty of the outcomes. Deterministic models provide exact outcomes given certain inputs, while probabilistic models deal with likelihoods and uncertainties.
What are some examples of deterministic relationships provided in the script?
-Examples of deterministic relationships include the formula for position as a function of time in physics, the volume of a cube as a function of its side length, and the circumference of a circle as a function of its radius or diameter.
Can you explain the concept of 'multiple regression' mentioned in the script?
-Multiple regression is a statistical technique where multiple independent variables (x values) are used to predict a single dependent variable (y). It generalizes the simple linear regression model to include more than one predictor.
Outlines
📚 Introduction to Regression Terminology
The first paragraph introduces essential terminology in the context of regression from lesson 10.2. It explains the concepts of the regression line and equation, the distinction between deterministic and probabilistic models, and the interchangeable terms for explanatory/predictor/independent variables and response/dependent variables. The paragraph also discusses the confusion between correlation and regression, and sets the stage for the rest of the lesson, which will delve into these topics in more detail.
🔍 Understanding Deterministic and Probabilistic Models
This paragraph delves into the specifics of deterministic models, which provide exact outcomes when the values of independent variables are known, using examples such as projectile motion, the volume of a cube, and the circumference of a circle. It contrasts these with probabilistic models, where the relationship between variables is not fully determined, illustrated by the example of a child's height in relation to their parents' heights. The paragraph introduces Sir Francis Galton's work on regression towards the mean, which is foundational to the terminology used in statistics.
📉 The Concept of Regression Line and Equation
The third paragraph discusses the regression line, also known as the line of best fit, which is used to model the relationship between two variables in a probabilistic model. It explains how the line is derived from a scatter plot of data points and introduces the concept of the least squares property. An example is given with chocolate consumption and the rate of Nobel laureates, demonstrating how the regression line and equation are used to predict values based on the sample data.
🧑🏫 Definitions and Notation in Regression Analysis
This paragraph provides definitions for key terms in regression analysis, such as the explanatory, predictor, and independent variables, as well as the response, dependent, and response variables. It explains the notation used for the regression equation, distinguishing between sample data and population data, and clarifies the use of y and y-hat to represent actual and predicted values, respectively.
🔑 The Significance of New Notation in Regression
The fifth paragraph explains the rationale behind the specific notation used in regression analysis, emphasizing its ability to generalize to models with multiple independent variables. It discusses the potential for a dependent variable to be influenced by more than one independent variable and how the notation accommodates this complexity, setting the stage for discussions on multiple regression.
📈 Linear Regression and Its Applications
The final paragraph of the script outlines the purpose of studying linear regression, which includes predicting the value of one variable based on another and quantifying the relationship between variables through marginal change. It also touches on the importance of ensuring a linear relationship before applying regression and introduces the concept of multiple regression, which involves multiple independent variables predicting a single dependent variable.
🤔 Clarifying the Relationship Between Correlation and Regression
In the last paragraph, the script clarifies the relationship between correlation and regression. It explains that while correlation is a measure of the linear relationship between two variables, regression involves finding the equation that best describes this relationship. The paragraph emphasizes that regression equations should only be used for predictions when there is evidence of a linear correlation between the variables.
Mindmap
Keywords
💡Regression Line
💡Regression Equation
💡Deterministic vs. Probabilistic Models
💡Explanatory Variable
💡Response Variable
💡Marginal Change
💡Correlation
💡Least Squares Property
💡Sir Francis Galton
💡Multiple Regression
Highlights
Defining essential terminology related to regression, including the regression line and regression equation.
Explaining the difference between deterministic and probabilistic models.
Clarifying that explanatory variable, predictor variable, and independent variable are synonymous, as are response variable and dependent variable.
Introducing the concept of marginal change and its distinction from correlation and regression.
Describing deterministic models where the dependent variable's value is immediately known given the independent variables.
Providing examples of deterministic models, such as position as a function of time in physics and the volume of a cube.
Discussing probabilistic models where the relationship between variables is not fully determined.
Using the example of a child's height as a function of parents' heights to illustrate a probabilistic model.
Introducing Sir Francis Galton's study on heredity and the concept of regression to the mean.
Defining the regression line as the line of best fit for a scatter plot of data based on the least squares property.
Presenting a real-world example of chocolate consumption versus the rate of Nobel laureates and its scatter plot.
Describing the regression equation and its components, including the predicted value (y-hat) and its relation to the independent variable (x).
Differentiating between sample data and population data in the context of regression equations.
Explaining the notation used in regression equations and the reason for using y-hat instead of y.
Discussing the potential for multiple regression, where more than one independent variable predicts a dependent variable.
Stressing the importance of ensuring a linear relationship before using a regression equation for predictions.
Defining marginal change in the context of a linear regression equation and its practical implications.
Linking the concepts of correlation and regression, emphasizing that regression is used for prediction when there is evidence of correlation.
Outlining the learning objectives for lesson 10.2, including when and how to compute a linear regression equation.
Transcripts
Browse More Related Video

10.2.0 Regression - Lesson Overview, Key Concepts, and Learning Outcomes
Correlation and Regression Analysis: Learn Everything With Examples

Regression and R-Squared (2.2)
Math 119 Chapter 10 part 2
Simple Linear Regression Concept | Statistics Tutorial #32 | MarinStatsLectures
Logistic Regression Details Pt1: Coefficients
5.0 / 5 (0 votes)
Thanks for rating: