Statistical Notation
TLDRThe video script emphasizes the importance of understanding statistical notation, which is crucial for grasping the language of statistics. It explains key symbols such as the sum of data set values (∑), individual data values (X), the number of data values in a sample (n), and the mean of a set of sample values (X̄). The distinction between sample (lowercase n) and population (uppercase N) is clarified, and the use of colors to differentiate between these concepts is suggested as a helpful learning tool. The script also highlights the significance of adhering to rounding rules for different statistical calculations.
Takeaways
- 📝 Statistical notation is crucial for understanding and communicating in the field of statistics.
- 🔢 The symbol Σ represents the sum of all data set values, which is a fundamental operation in statistical analysis.
- 🅿️ The variable X is used to denote individual data values or a category of data, such as class pulse rate.
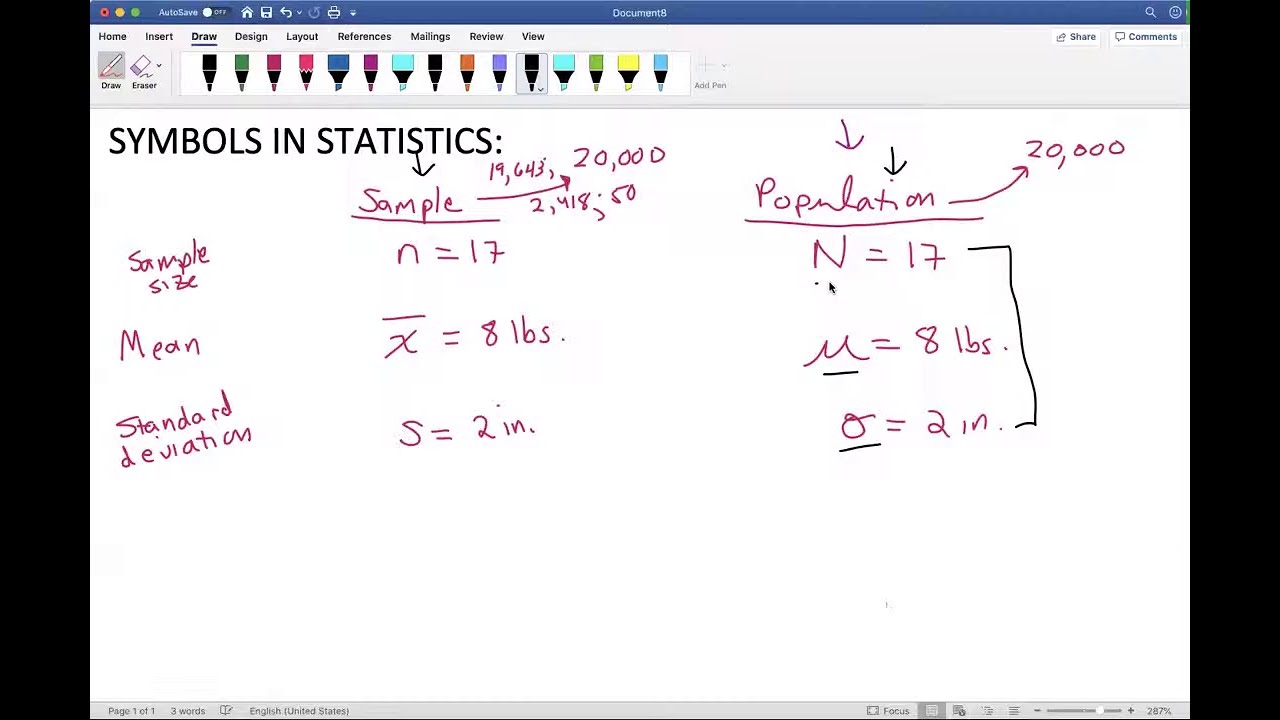
- 📈 The lowercase 'n' indicates the number of data values in a sample, while the uppercase 'N' is used for the entire population.
- 🔍 The choice between lowercase and uppercase depends on the context of data collection and the type of conclusions being drawn.
- 📊 The mean (X̄) of a set of values is calculated by dividing the sum of X by the number of values (lowercase 'n' for sample, uppercase 'N' for population).
- 📝 Rounding rules are essential to include in calculations; for mean, median, and mid-range, one additional decimal is used compared to the original values.
- 🎨 Using different colors for notations can aid in distinguishing between sample and population data, and is a helpful technique for visual learners.
- 🎓 A personal anecdote from graduate school illustrates the effectiveness of using colors for better understanding and retention of complex statistical concepts.
- 🏆 Embracing one's learning style, such as using colors, can lead to academic success, as demonstrated by the speaker's experience.
- 🚫 Do not let others' opinions or mockery deter you from using effective study techniques that work for you.
- 🎯 Focus on comprehension and achieving a good grade, as these are the ultimate goals of the class and reflect your understanding of the material.
Q & A
What is the significance of statistical notation in the study of statistics?
-Statistical notation is crucial in statistics as it serves as the language through which statistical concepts are communicated. Understanding these notations and symbols is key to grasping the subject matter and applying statistical methods accurately.
What does the symbol Σ represent in statistical notation?
-The symbol Σ represents the sum of all data set values. Whenever you see this notation, it signifies that you are to add up all the individual values within the data set.
How is the variable X used in statistics?
-In statistics, the variable X is used to represent individual data values or a category of data as a whole. It can refer to specific data points, such as individual pulse rates, or to the general category of data being studied, such as class pulse rate.
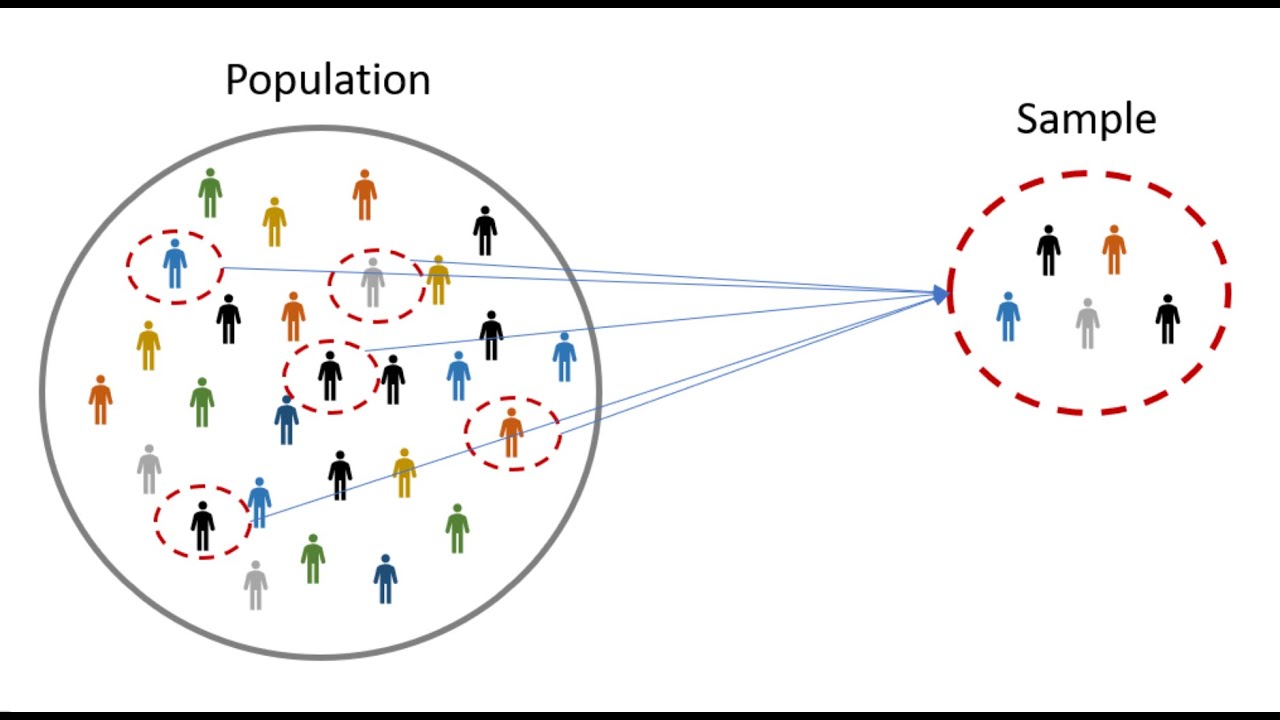
What is the difference between lowercase 'n' and uppercase 'N' in statistical notation?
-Lowercase 'n' indicates the number of data values in a sample, while uppercase 'N' is used when referring to an entire population. The distinction is important because it determines whether you are making predictions about a larger group or making statements about the specific group that was measured.
How do you calculate the mean of a set of sample values?
-To calculate the mean (often represented as X̄), you sum all the values in the data set (ΣX) and then divide by the number of values in the sample (n). This gives you the average value for the sample.
What is the rounding rule mentioned in the script, and when is it applied?
-The rounding rule mentioned in the script states that for calculations involving the mean, median, and mid-range, you should carry the result one more decimal point than is present in the original values. This allows for a certain degree of precision without overstating it. However, the mode is left as is without any rounding since it is an actual data value.
How can using colors help in understanding and remembering statistical concepts?
-Using colors can aid in visual learning by associating different colors with specific components of formulas or data sets. This can help in distinguishing between various elements, enhancing memory retention, and improving overall comprehension of complex statistical concepts.
What is the importance of the story shared about using colored pencils in graduate school?
-The story emphasizes the importance of using personal learning techniques that work best for an individual, regardless of others' opinions. It highlights that focusing on comprehension and achieving good grades should be the primary goals, and one should not be deterred by others' mockery or lack of understanding of one's learning methods.
What is the symbol used to represent the population mean in statistics?
-The population mean is represented by the symbol μ (mu). This is used when making statements about the entire population from which a sample was drawn.
How can the use of different notations help in distinguishing between sample and population data?
-Different notations, such as lowercase 'n' for sample size and uppercase 'N' for population size, help in clearly distinguishing between the two. This is important for accurately interpreting the data and for applying the correct statistical methods and formulas.
What is the advice given in the script for keeping track of statistical notations and concepts?
-The advice given is to use different colored pencils or ink to indicate whether the data or symbols are from a sample or a population. This visual aid can help in keeping track of the appropriate symbols to use and the conclusions that can be drawn from the data.
Outlines
📚 Introduction to Statistical Notation
This paragraph introduces the fundamental concepts of statistical notation, emphasizing the importance of understanding and memorizing these symbols as they form the basis of statistical language. The speaker suggests using a separate sheet of paper to note down notations and definitions, along with examples for better comprehension. The paragraph begins with an explanation of the summation notation, followed by the variable X used to represent individual data values or a category of data. The distinction between lowercase 'n' for sample size and uppercase 'N' for population size is clarified, highlighting how this affects the interpretation of data. The paragraph concludes with a discussion on the use of statistical formulas, specifically the calculation of the mean (X bar) and the importance of adhering to rounding rules in statistical calculations.
🎨 Utilizing Color Coding for Statistical Understanding
The second paragraph discusses the benefits of using color coding to differentiate between sample and population data, which can aid in keeping track of statistical symbols and the conclusions that can be drawn from them. The speaker shares a personal anecdote from graduate school, where using colored pencils to color-code Venn diagrams and formulas helped in understanding complex statistical concepts. The story illustrates the effectiveness of visual learning techniques and encourages students to adopt methods that work best for them, regardless of others' opinions. The paragraph ends with a reminder to focus on comprehension and academic achievement, suggesting the use of colored pencils as a tool to enhance understanding of statistical material.
Mindmap
Keywords
💡Statistical Notation
💡Summation
💡Variable
💡Sample
💡Population
💡Mean
💡Rounding Rule
💡Visual Learning
💡Multiple Linear Regression Analysis
💡Measures of Central Tendency
💡Sampling Technique
💡Data Analysis
Highlights
The importance of understanding statistical notation as the language of statistics.
The suggestion to use a separate sheet of paper to note down notations, definitions, and examples for better comprehension.
The definition of the summation symbol (∑) as the sum of all data set values.
The use of the variable X to represent both individual data values and the category of data.
The distinction between lowercase 'n' for sample data values and uppercase 'N' for population data.
The example given regarding the application of these notations in a study about fish in a pond.
The explanation of how to calculate the mean (X̄) of a set of sample values.
The rounding rule for mean, median, and mid-range, and how it differs for the mode.
The story from graduate school emphasizing the power of visual learning and personal learning techniques.
The professor's acknowledgment of the effectiveness of using colored pencils for understanding complex concepts.
The advice to focus on comprehension and grades rather than being ashamed of the techniques that help achieve them.
The encouragement to use different colored pencils or ink to distinguish between sample and population data.
The upcoming discussion on calculating other measures of center in future lectures.
The emphasis on the practical application of statistical methods in various fields, such as predicting pulse rates of students.
The importance of keeping track of statistical formulas and rounding rules to avoid confusion.
The anecdote illustrating the benefits of personal learning strategies and defending one's methods against criticism.
Transcripts
Browse More Related Video
Symbols in statistics. Sample or Population?

What is Variance in Statistics? Learn the Variance Formula and Calculating Statistical Variance!
Statistics: Populations & Samples and Parameters vs Statistics

Statistical Symbols
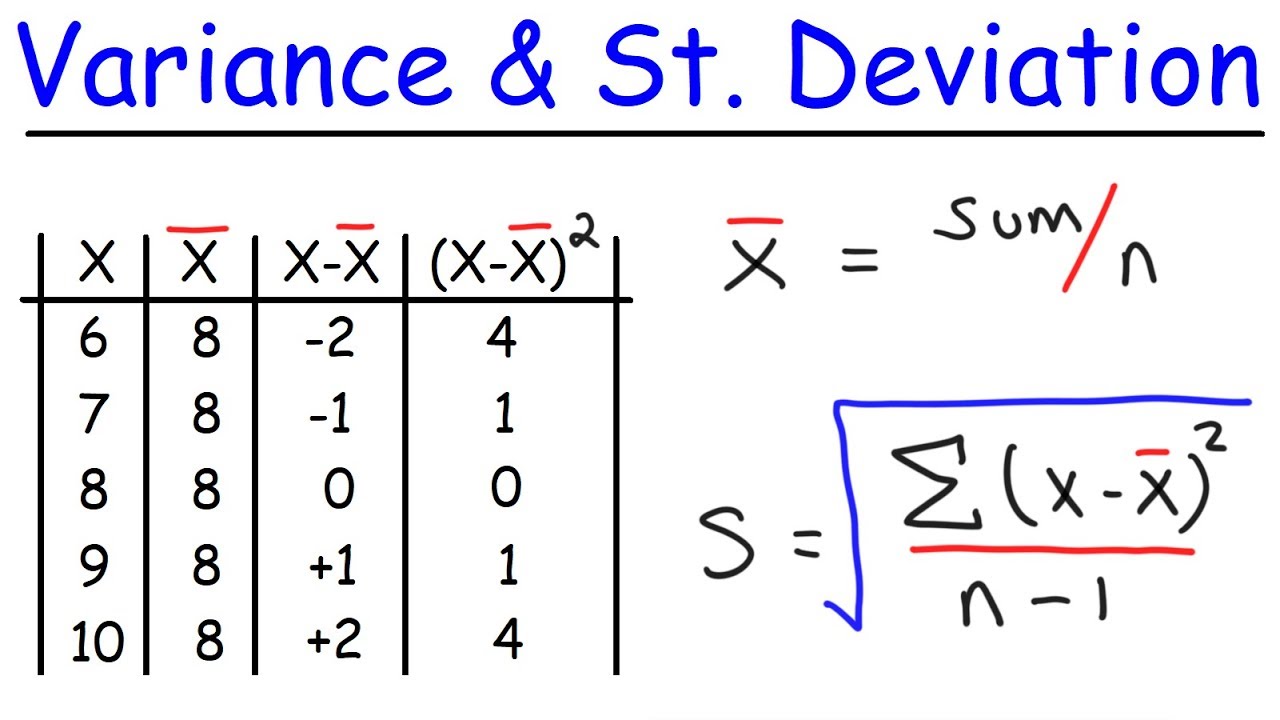
Variance and Standard Deviation With Microsoft Excel - Descriptive Statistics

Statistics: Standard deviation | Descriptive statistics | Probability and Statistics | Khan Academy
5.0 / 5 (0 votes)
Thanks for rating: