What is Central Tendency – An Introduction to Mean, Median, and Mode in Statistics (5-1)
TLDRIn this educational video, Dr. Todd Daniel introduces viewers to the concept of displaying data numerically, focusing on the importance of central tendency. He explains the three measures of central tendency—mean, median, and mode—and their applications. The video clarifies when to use each measure, considering the scale of measurement and the distribution's shape. It emphasizes the benefits of simplification and prediction that these measures provide, using relatable examples to illustrate their practical significance.
Takeaways
- 📊 The video discusses three measures of central tendency: mean, median, and mode, and their applications in data analysis.
- 🔍 Central tendency is used to find the center of a data set and is crucial for understanding data distribution.
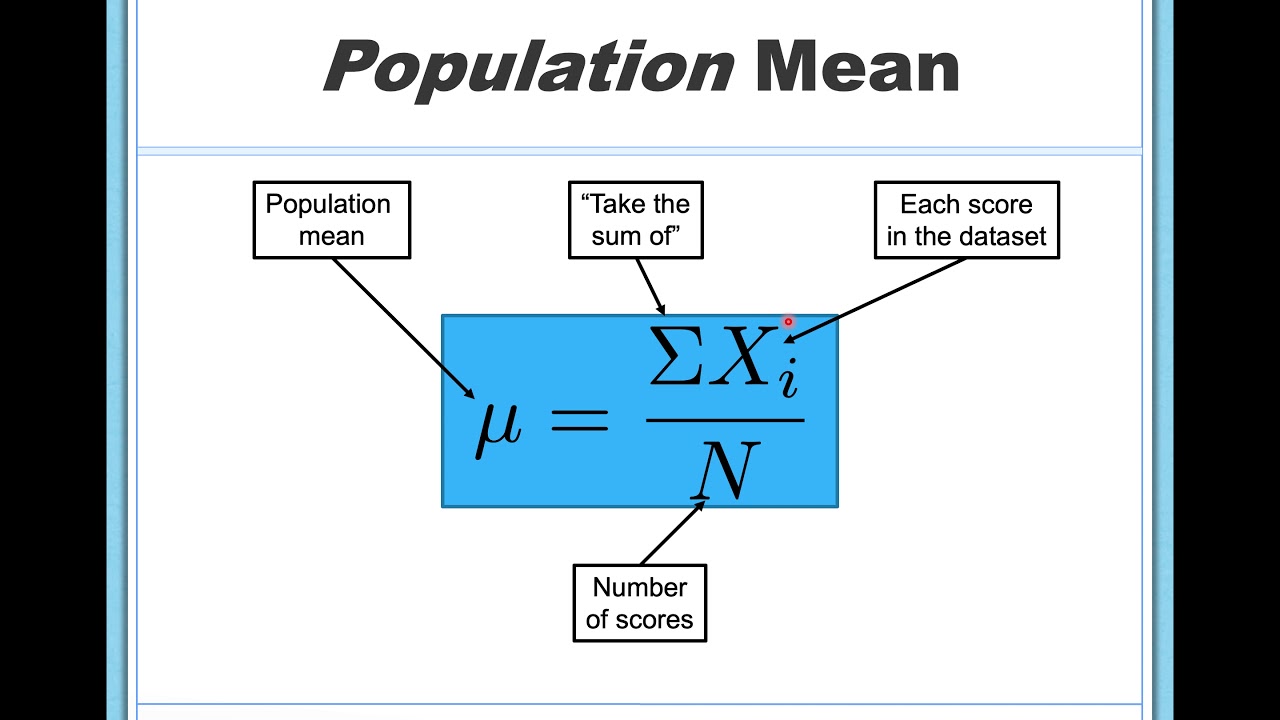
- 🧠 The mean is the average of the data and is typically used with interval or ratio level data.
- 📈 The median is the middle value in a data set and is less affected by outliers, making it useful for skewed distributions.
- 📚 The mode is the most frequently occurring value in the data and is applicable to nominal and ordinal data.
- 🤔 Two key questions addressed are: what single number best represents the data, and how spread out or clustered the scores are.
- 🏀 An example is given using basketball players and horse jockeys to illustrate the concept of central tendency in everyday assumptions.
- 📊 Simplification is a benefit of central tendency as it reduces complex data into a single representative number.
- 🔮 Central tendency aids in prediction, such as estimating future needs based on average family size and population growth.
- ⚖️ The choice of central tendency measure depends on the scale of measurement and the shape of the data distribution.
- 📉 The mean, median, and mode each have specific uses and are chosen based on the characteristics of the data set being analyzed.
- 📝 Understanding central tendency helps in interpreting data and making informed decisions based on statistical analysis.
Q & A
What is the main focus of the video script provided by Dr. Todd Daniel?
-The main focus of the video script is to teach how to display data with numbers, specifically how to determine and understand measures of central tendency such as mean, median, and mode.
Why is it important to know the center of the data?
-Knowing the center of the data is important because it helps to answer questions about where the middle of the distribution is and provides a single number that can represent the entire data set, which is useful for simplification and prediction.
What are the three measures of central tendency mentioned in the script?
-The three measures of central tendency mentioned are mean, median, and mode.
What does the mean represent in terms of data?
-The mean represents the average value of the data set, which is calculated by summing all the data points and dividing by the number of points.
How is the median different from the mean?
-The median is the middle value of a data set when the numbers are arranged in numerical order, whereas the mean is the average value. The median is less affected by extreme values and provides a better representation of the center for skewed data.
What is the mode and when is it most useful?
-The mode is the value that appears most frequently in a data set. It is most useful when dealing with categorical data or when the data set contains non-numeric values.
Why might the mean not be the best measure of central tendency for a skewed distribution?
-The mean might not be the best measure for a skewed distribution because it can be heavily influenced by outliers or extreme values, which can distort the central location of the data.
What is the benefit of using measures of central tendency for simplification?
-The benefit of using measures of central tendency for simplification is that it reduces the complexity of the entire data set to a single number, making it easier to understand and communicate the general trend or location of the data.
How can measures of central tendency be used for prediction?
-Measures of central tendency can be used for prediction by providing an estimate or average that can help forecast future trends or needs, such as predicting the number of new classroom seats needed based on the average family size.
What factors determine which measure of central tendency to use?
-The choice of a measure of central tendency depends on the scale of measurement (nominal, ordinal, interval, or ratio) and the shape of the data distribution, especially if it is skewed or kurtotic.
Can you provide an example of how measures of central tendency are used in everyday life?
-An example from the script is the assumption about the height of a basketball player or a horse jockey based on the general height tendencies of those professions, which is an informal use of measures of central tendency.
Outlines
📊 Introduction to Central Tendency
Dr. Todd Daniel introduces the concept of displaying data with numbers, focusing on the importance of understanding central tendency. He explains that central tendency is a measure that indicates the center of a data set and is crucial for understanding whether the data is generally high or low. The video will cover three specific measures of central tendency: mean, median, and mode, and when to use each. Dr. Daniel also emphasizes the benefits of central tendency, such as simplification of raw data and the ability to predict or estimate future needs based on the average or common values.
Mindmap
Keywords
💡Central Tendency
💡Mean
💡Median
💡Mode
💡Data Distribution
💡Skewness
💡Kurtosis
💡Scale of Measurement
💡Simplification
💡Prediction
💡Basketball Player
💡Horse Jockey
Highlights
Introduction to displaying data with numbers, in addition to pictures.
Central tendency is the key to understanding where the center of the data lies.
Three main measures of central tendency: mean, median, and mode.
Explanation of when to use each measure of central tendency.
Central tendency answers the question of how representative a single number is for the entire data set.
Understanding if scores are generally high or low using measures of central tendency.
The importance of context in interpreting raw scores, exemplified by test scores and class averages.
Using central tendency to make assumptions about groups, like basketball players' heights.
Benefits of simplification provided by measures of central tendency for complex data sets.
The predictive power of central tendency for estimating future needs or scores.
The average family having 2.3 children as an example of predictive use of central tendency.
Determining the appropriate measure of central tendency based on the scale of measurement.
The influence of data distribution shape on the choice of central tendency measure.
Mean is typically used with interval or ratio level data for central tendency.
The handling of skewed or kurtotic distributions when choosing a central tendency measure.
The uniqueness of each measure of central tendency in describing data distribution.
Transcripts
Browse More Related Video
Mean, Median, Mode, and Outliers: Measures of Central Tendency
Measures of Central Tendency (Mean, Median, Mode)
Understanding Central Tendency
Statistics: The average | Descriptive statistics | Probability and Statistics | Khan Academy
What is Variability? – An Introduction to Variance in Statistics (6-1)

What are Mean, Median and Mode? | Statistics | Infinity Learn
5.0 / 5 (0 votes)
Thanks for rating: