A/B Testing Mistakes to Avoid in Your Data Science Interview: Tips and Tricks!
TLDRThis video script discusses common pitfalls in interpreting A/B testing results and emphasizes the importance of statistical understanding for data-driven decision-making. It categorizes mistakes into two groups: misunderstanding statistical concepts and assuming results' validity without considering external factors. The script outlines scenarios like data peeking, multiple testing issues, and the misinterpretation of non-significant results, offering practical advice on how to avoid these errors and ensure reliable experimentation outcomes.
Takeaways
- 📊 Misunderstanding Statistical Concepts: The video emphasizes the importance of understanding statistical concepts to avoid common mistakes when interpreting A/B testing results.
- 🚫 Data Peeking: Stopping an experiment early when the p-value falls below a certain threshold can lead to inaccurate and unreliable results.
- 🔢 Statistical Power: Ensuring the experiment is run for a pre-determined duration to maintain statistical power and avoid premature conclusions.
- 📈 Multiple Testing Problem: The risk of type 1 errors increases when testing multiple hypotheses simultaneously without adjusting the significance level.
- 🔑 Two-Step Rule: A practical approach to control type 1 and type 2 errors by categorizing metrics into groups and applying different significance levels.
- 📝 Scenario Summarization: The video provides scenarios to illustrate common mistakes, such as data peeking and multiple testing problems.
- 📉 No Significance ≠ No Effect: Not finding statistical significance does not necessarily mean there is no treatment effect; it could be due to insufficient statistical power.
- 🔄 Reproducibility: The goal of A/B testing is to ensure results are reproducible, which requires running experiments as designed to avoid biased outcomes.
- 🛠️ Educating Others: Data scientists have a responsibility to educate other professionals about proper data interpretation to prevent misunderstandings.
- 🔍 Sanity Checks: The video hints at the importance of performing sanity checks to ensure the reliability of results before analysis, which will be covered in a follow-up video.
- 👋 Stay Tuned: The channel offers more content on A/B testing and data science, encouraging viewers to subscribe for upcoming topics.
Q & A
What are the common mistakes people make when interpreting A/B testing results?
-The common mistakes include misunderstanding or lack of understanding of statistical concepts and assuming the results are valid and reliable without considering factors that can make the results useless.
What is the role of a data scientist in correcting mistakes made during A/B testing?
-A data scientist's role is to educate others on statistical concepts, help them interpret data correctly, and drive data-informed decision making in the organization.
What is the issue with stopping an experiment early when the p-value falls below 0.05?
-Stopping an experiment early can lead to unreliable results because the data collected is incomplete, potentially leading to inaccurate estimates of the treatment effect.
Why is it incorrect to base decisions on a single metric with a p-value below 0.05 in a multi-metric experiment?
-This approach can lead to a multiple testing problem, increasing the probability of a type 1 error, where a true null hypothesis is incorrectly rejected.
What is the two-step rule of thumb to control type 1 and type 2 errors when dealing with unexpectedly significant metrics?
-The two-step rule involves categorizing metrics into groups based on expected impact and applying different significance levels to each group to control for type 1 and type 2 errors.
Why might a claim of 'no training effect' when a metric is not statistically significant be a mistake?
-It can be a mistake if the test is underpowered, meaning there are not enough randomization units to detect the effect size that is actually present.
What should a data scientist do if an experiment is underpowered?
-The data scientist should either continue running the experiment if possible or re-run it to ensure enough users are included to detect the desired change and achieve sufficient statistical power.
What is the significance of statistical power in the context of A/B testing?
-Statistical power is crucial as it determines the ability of a test to detect an effect if it exists. A test with high statistical power is more likely to produce reliable and reproducible results.
How can data peeking lead to biased results in A/B testing?
-Data peeking can lead to biased results because it involves stopping data collection when the test appears significant, which can happen by chance and does not guarantee a true effect.
What are some scenarios where multiple testing problems may occur?
-Multiple testing problems can occur when looking at multiple metrics in a single A/B test, testing one metric with multiple treatment groups, analyzing different segments of the population, or running multiple iterations of an A/B test in parallel.
Outlines
📊 Common Mistakes in Interpreting A/B Testing Results
The speaker introduces the video by highlighting the importance of understanding common mistakes made when interpreting A/B testing results. These mistakes can affect decision-making and are crucial for data scientists to recognize and correct. The video will cover two main groups of mistakes: misunderstanding of statistical concepts and assuming results are valid without considering external factors. The first group is the focus of this video, with the second to be discussed in a subsequent video. The speaker emphasizes the role of data scientists in educating others and ensuring data-informed decision-making.
🔍 Addressing Misinterpretation of Statistical Concepts in A/B Testing
This paragraph delves into specific scenarios where statistical concepts are often misunderstood or misinterpreted. The speaker discusses 'data peeking', where experiments are stopped prematurely due to significant results, which can lead to unreliable findings. The importance of running experiments for a pre-determined duration to ensure statistical power and reproducibility is stressed. Additionally, the paragraph addresses the multiple testing problem, where testing multiple hypotheses simultaneously increases the risk of type 1 errors. The speaker provides a practical solution using a two-step rule to categorize metrics and apply different significance levels to control for these errors.
🚫 Avoiding Errors in Statistical Assumptions and A/B Testing
The final paragraph warns against the mistake of assuming there is no treatment effect when a metric does not show statistical significance. The speaker explains that this could be due to an underpowered test, where there are not enough randomization units to detect the effect size. The importance of having sufficient statistical power is emphasized, and the speaker advises continuing or re-running the experiment to ensure reliable data. The paragraph concludes with a reminder of the data scientist's role in educating others about statistical concepts and the promise of further videos on A/B testing and data science topics.
Mindmap
Keywords
💡A/B Testing
💡P-value
💡Statistical Power
💡Significance Level
💡Data Peeking
💡Multiple Testing Problem
💡Type I and Type II Errors
💡Statistical Significance
💡Underpowered Test
💡Reproducibility
💡Data Scientist
Highlights
The video discusses common mistakes made in interpreting A/B testing results and using them for launch decisions.
Mistakes are categorized into misunderstanding of statistical concepts and assuming results are valid without considering external factors.
Data scientists play a role in correcting these mistakes and driving data-informed decision making.
The video is split into two parts, focusing on statistical concept misunderstandings in the first part.
Data peaking is identified as a common mistake where experiments are stopped early when results seem significant.
Stopping experiments early can lead to inaccurate and non-reproducible results.
The importance of statistical power and significance level in experiment design is explained.
Multiple testing problems occur when testing more than one hypothesis simultaneously, leading to a higher chance of type 1 errors.
A practical two-step rule is suggested to control type 1 and type 2 errors in the context of unexpected metric significance.
Metrics should be categorized into groups based on expected impact for more accurate significance level application.
The video provides a concrete example of how to apply different significance levels to different groups of metrics.
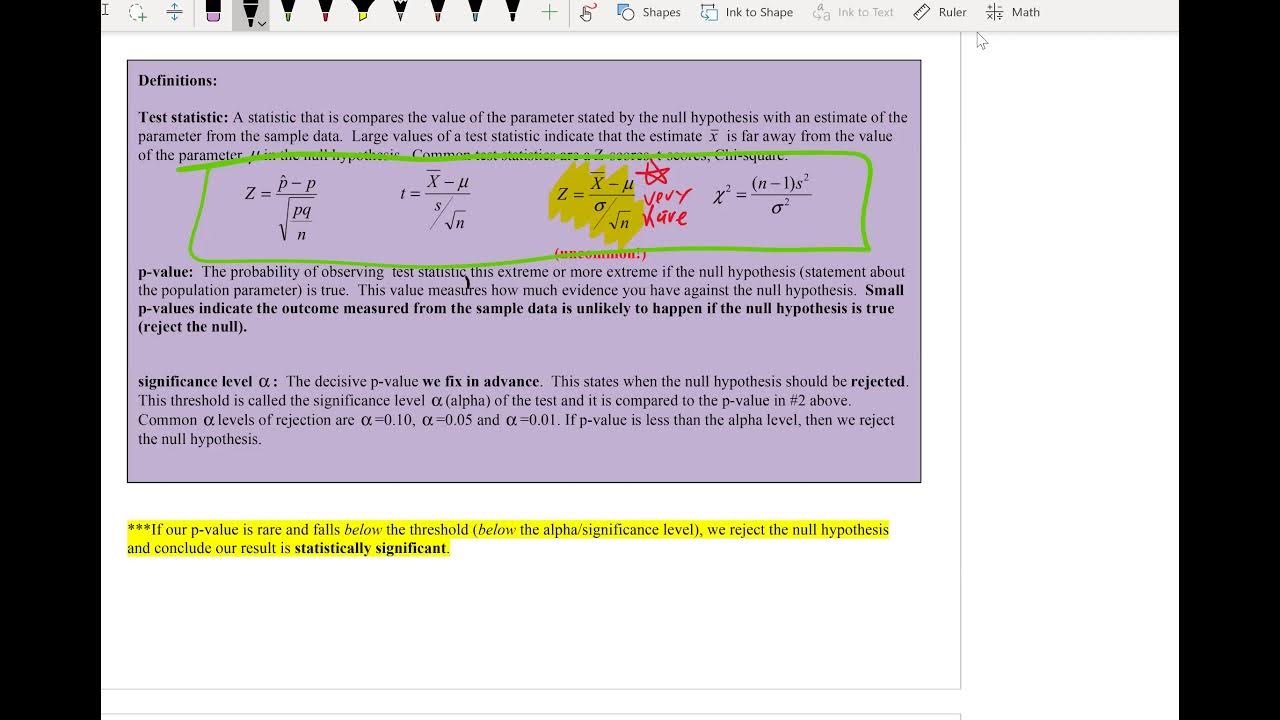
Statistical significance is defined and its importance in comparing p-values is discussed.
The mistake of claiming no treatment effect when a metric is not statistically significant is addressed.
The importance of ensuring sufficient statistical power to detect the effect size is highlighted.
The video emphasizes the responsibility of data scientists in educating others on correct data interpretation.
The second part of the video will cover important sanity checks to ensure reliable results before analysis.
A call to action for viewers to like, subscribe, and stay tuned for more content on A/B testing and data science.
Transcripts
Browse More Related Video

A/B Testing in Data Science Interviews by a Google Data Scientist | DataInterview
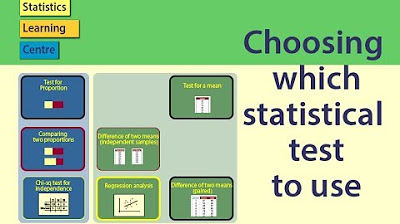
Statistical Tests: Choosing which statistical test to use
A/B Testing Analysis Made Easy: How to Use Hypothesis Testing for Data Science Interviews!

Power Analysis and Sample Size Decisions
Math 119 Chap 8 part 1
Permutation Hypothesis Test in R with Examples | R Tutorial 4.6 | MarinStatsLectures
5.0 / 5 (0 votes)
Thanks for rating: