Math 119 Chap 8 part 1
TLDRThis instructional video script delves into the fundamentals of hypothesis testing, focusing on chapters eight to ten. It emphasizes the importance of understanding these chapters for statistical analysis. The script explains the concepts of null and alternative hypotheses, types of tests, and the significance of p-values. It also introduces the seven-step hypothesis testing process, using examples to illustrate how to apply these concepts, including calculating test statistics and interpreting results to make informed decisions about population parameters.
Takeaways
- 📚 The main topic of the script is hypothesis testing, which is a statistical method used to evaluate claims about population parameters like proportion, mean, or standard deviation.
- 🔍 Hypothesis testing involves developing a technique to test claims by finding evidence against them, which can challenge the status quo or common beliefs.
- 🎯 The primary objective of the chapter is to teach how to conduct hypothesis tests for population proportion (p), population mean (μ), and population standard deviation (σ).
- 🤔 The concept of the 'rare event rule' is introduced, which states that if the probability of observing a particular event is very small under a given assumption, the assumption is likely incorrect.
- 🪙 An example of testing the fairness of a coin is provided, illustrating how the number of heads in 100 flips can lead to the conclusion about the coin's fairness.
- 📉 The script explains the importance of understanding the difference between the null hypothesis (H₀) and the alternative hypothesis (H₁ or Hₐ), and how they are formulated with respect to the problem at hand.
- 📊 The significance of test statistics, such as z-scores, t-scores, and chi-squared, is highlighted as they compare the parameter estimate from the sample data to the parameter stated in the null hypothesis.
- 📈 The p-value is described as a measure of the probability of observing the test statistic as extreme as, or more extreme than, what was observed, assuming the null hypothesis is true.
- 🛑 The script discusses the concept of significance level (α), which is a threshold used to determine whether to reject the null hypothesis based on the p-value.
- 🔮 The potential for errors in hypothesis testing is acknowledged, including Type I (false positive) and Type II (false negative) errors, which can occur when rejecting or failing to reject the null hypothesis, respectively.
- 👨🏫 The instructor emphasizes the importance of understanding the formulas and concepts behind hypothesis testing, suggesting that students should include them in their study materials for reference.
Q & A
What is the main topic of Chapter 8 in the transcript?
-The main topic of Chapter 8 is hypothesis testing, which involves developing techniques to test claims about certain population parameters such as proportion (p), mean (mu), or standard deviation (sigma).
What is the purpose of hypothesis testing?
-The purpose of hypothesis testing is to evaluate claims that are made about a population by using sample data to find evidence against these claims or to support them.
What does the 'rare event rule' refer to in the context of hypothesis testing?
-The 'rare event rule' states that if the probability of observing a particular event is exceptionally small under a given assumption, we conclude that the original assumption is likely incorrect.
How does the example of the United States Mint and the coin flips relate to hypothesis testing?
-The example illustrates the concept of hypothesis testing by testing the fairness of a coin. If the observed number of heads significantly deviates from the expected 50% in 100 flips, it provides evidence against the assumption that the coin is fair.
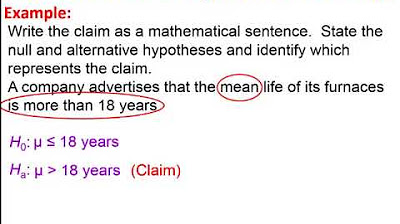
What are the null hypothesis and the alternative hypothesis in a hypothesis test?
-The null hypothesis (H0) is a statement that the parameter of the population is at least equal to a specific value and always includes the equal sign. The alternative hypothesis (H1 or Ha) states that the parameter has a value different from the null hypothesis, either greater than, less than, or not equal to the null stated value.
What is a 'p-value' in hypothesis testing?
-The p-value is the probability of observing a test statistic that is as extreme or more extreme than the one calculated from the sample data, assuming the null hypothesis is true. It measures the evidence against the null hypothesis, with small p-values indicating strong evidence to reject the null hypothesis.
What is the significance of the 'significance level alpha' in hypothesis testing?
-The significance level alpha is a threshold value that is compared to the p-value to decide whether to reject the null hypothesis. If the p-value is less than or equal to alpha, the null hypothesis is rejected.
What are 'Type 1' and 'Type 2' errors in the context of hypothesis testing?
-A Type 1 error is the mistake of rejecting the null hypothesis when it is actually true (false positive). A Type 2 error is the mistake of failing to reject the null hypothesis when it is actually false (missed the true effect).
Can you explain the seven-step process mentioned for conducting a hypothesis test?
-The seven-step process for conducting a hypothesis test involves: 1) Formulating the null and alternative hypotheses, 2) Setting the significance level (alpha), 3) Identifying the type of test (left-tailed, right-tailed, or two-tailed), 4) Calculating the test statistic, 5) Finding the critical value or p-value, 6) Making a decision to reject or fail to reject the null hypothesis based on the test statistic and critical value/p-value, and 7) Drawing conclusions from the test results.
How is the test statistic calculated for a hypothesis test involving a population proportion?
-The test statistic for a hypothesis test involving a population proportion is calculated using the formula: (p-hat - p) / sqrt((p * q) / n), where p-hat is the sample proportion, p is the population proportion from the null hypothesis, q is 1 - p, and n is the sample size.
Outlines
📚 Introduction to Hypothesis Testing
This paragraph introduces the concept of hypothesis testing, emphasizing its importance in chapters eight to eleven. The speaker explains that hypothesis testing involves challenging preconceived notions or societal views with evidence. The main goal is to test claims about population parameters such as proportion (p), mean (mu), or standard deviation (sigma). An example of a fair coin is used to illustrate the principle of hypothesis testing, where the number of heads in 100 flips would be expected to be 50 if the coin were fair. The speaker also introduces the rare event rule and the concept of null and alternative hypotheses.
🔍 Hypothesis Notation and Examples
The speaker discusses how to notate null and alternative hypotheses using population parameters and provides examples. The first example involves testing whether the accident rate among young drivers has increased since 2003, using a proportion (p). The second example is about a psychological test score mean (mu) for college students, and the third example is about the smoking rate (p) among college graduates compared to the general population. The speaker emphasizes the importance of understanding the formulas and concepts behind hypothesis testing for effective problem-solving.
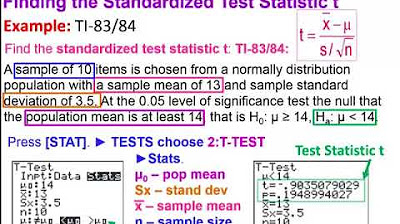
📉 Understanding Test Statistics and P-Value
This section delves into the concept of test statistics, which compare the parameter value stated in the null hypothesis with an estimate from sample data. The speaker explains that large test statistic values indicate a significant difference from the null hypothesis parameter. Common test statistics include z-scores, t-scores, and chi-squared, with a brief mention of the uncommon use of chi-squared for testing means when the standard deviation is known. The p-value is introduced as a measure of the probability of observing the test statistic under the null hypothesis, with small p-values suggesting strong evidence against the null hypothesis.
🛑 Significance Level and Hypothesis Testing Errors
The speaker introduces the significance level (alpha) as a predetermined threshold for making decisions in hypothesis testing. If the p-value is less than or equal to alpha, the null hypothesis is rejected. Common alpha levels are 10%, 5%, and 1%. The speaker also explains the potential for errors in hypothesis testing, such as type I and type II errors, which occur when incorrectly rejecting a true null hypothesis or failing to reject a false null hypothesis, respectively. Examples of these errors in the context of medical testing are provided.
🚀 Seven-Step Hypothesis Testing Process
The speaker outlines a structured seven-step process for conducting hypothesis tests, starting with creating hypotheses based on claims and deciding on the significance level. The process includes determining the type of test (one-tailed or two-tailed), calculating the test statistic, finding the critical value, making a decision to reject or fail to reject the null hypothesis, and drawing a conclusion based on the analysis. The speaker emphasizes the importance of understanding this process for effectively applying hypothesis testing in various scenarios.
📉 Hypothesis Testing with CEO Gender Example
The speaker presents a practical example of hypothesis testing using data about the gender of CEOs in companies. A sample of 706 companies found that 61% of CEOs were male, and the researcher hypothesizes that most CEOs are male. The speaker guides through setting up the null and alternative hypotheses, choosing the significance level (0.05), and identifying the type of test (right-tailed). The test statistic is calculated using the formula for a population proportion, and the process is explained in detail.
📊 Interpreting the Test Statistic and Drawing Conclusions
In this paragraph, the speaker explains how to interpret the test statistic in the context of a normal distribution curve. The test statistic is compared to a critical value to determine whether it falls in the rejection or fail-to-reject region. The speaker uses the example of a right-tailed test with a 5% significance level, finding the critical z-value and illustrating where the test statistic would fall on the curve. The decision to reject the null hypothesis is based on the test statistic's position, leading to the conclusion that there is sufficient evidence to support the claim if the null is rejected.
🏁 Final Conclusion and Summary
The speaker concludes the hypothesis testing example by stating that there is sufficient evidence to support the claim that most CEOs are male, based on the statistical analysis. The conclusion is reworded to reflect the original problem's context, and the speaker emphasizes the importance of understanding the process and potential errors in hypothesis testing. The video ends with the speaker's intention to continue the topic in the next class or video.
Mindmap
Keywords
💡Hypothesis Testing
💡Null Hypothesis (H₀)
💡Alternative Hypothesis (H₁ or Hₐ)
💡Population Proportion (p)
💡Population Mean (μ)
💡Significance Level (α)
💡P-Value
💡Test Statistic
💡Type I Error
💡Type II Error
💡Confidence Intervals
Highlights
Introduction to hypothesis testing as a method to evaluate claims about population parameters.
Emphasis on understanding Chapter 8 for success in subsequent chapters on hypothesis testing.
Explanation of the concept of hypothesis testing as finding evidence against a presumed societal view.
Importance of the main objective of the chapter: testing claims about population proportion, mean, or standard deviation.
Introduction of the rare event rule in hypothesis testing for concluding incorrect assumptions.
Example of testing the fairness of a coin using hypothesis testing.
Illustration of how to determine if there is enough evidence to conclude a coin is not fair.
Discussion on the significance of the number of heads in a coin flip experiment and its relation to hypothesis testing.
Explanation of the null hypothesis and its role in hypothesis testing.
Clarification of the alternative hypothesis and its contrast to the null hypothesis.
Introduction of the concepts of one-tailed, two-tailed tests, and their implications in hypothesis testing.
Use of the United States Mint coin example to explain the application of hypothesis testing.
Importance of understanding the formulas for hypothesis testing and their role in statistical analysis.
Discussion on the concept of test statistics as a comparison tool between the null hypothesis and sample data.
Explanation of p-value as a measure of evidence against the null hypothesis.
Introduction of significance level alpha and its role in hypothesis testing decisions.
Description of type 1 and type 2 errors in the context of hypothesis testing.
Example of applying hypothesis testing to a scenario involving disease testing and its potential errors.
Seven-step process for hypothesis testing introduced for structured problem-solving.
Application of the seven-step hypothesis testing process to a problem involving CEO gender proportion.
Final conclusion template for hypothesis testing problems, emphasizing the evidence-based decision-making.
Transcripts
Browse More Related Video

Math 119 Chap 8 part 2

Math 119 Chapter 9 part 1
Elementary Statistics Chapter 8 - Introduction Hypothesis Testing Part 1 Lesson 1

Session 45 - Hypothesis Testing Part 1 | DSMP 2023
Elementary Statistics - Chapter 8 - Hypothesis Testing Part 3 Revised

AP Statistics Unit 6 Summary Review Inference for Proportions Part 2 Significance Tests
5.0 / 5 (0 votes)
Thanks for rating: