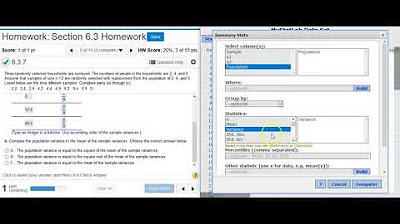
Math 14 HW 6.3.7-T Is the sample variance an unbiased estimator of the population variance?
TLDRThe video demonstrates the process of calculating population variance and sample variance using a dataset of children's ages (1, 2, and 12). It outlines how to use StatCrunch software to find the population variance (24.667) and the variances of nine different samples. The video also explains how to create a probability distribution table of the sample variances and determine if the sample variance is an unbiased estimator of the population variance. The final conclusion is that the sample variance is an unbiased estimator of the population variance.
Takeaways
- 🔢 The script involves a statistical exercise where three children with ages 1, 2, and 12 are surveyed, and samples of size n=2 are randomly selected with replacement from the population.
- 📊 Nine different samples are listed, and the task is to analyze the data using statistical software, in this case, StatCrunch.
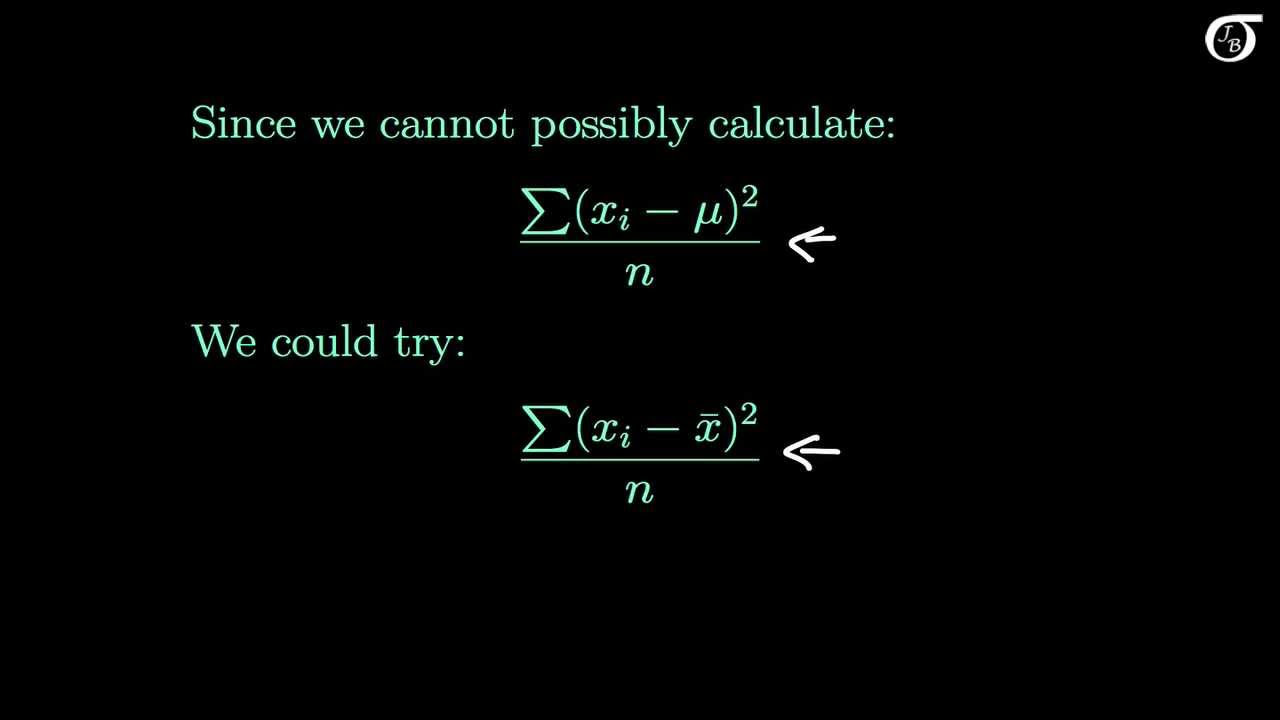
- 📝 The first step in the analysis is to calculate the population variance using the numbers 1, 2, and 12, resulting in a variance of 24.667 when rounded to three decimal places.
- 📉 The script then instructs to find the variance of each of the nine samples and summarize the sampling distribution of the variances in a table format, representing the probability distribution of the distinct variance values.
- 🎯 The script demonstrates how to use StatCrunch to calculate the variance for each row of data, storing the results in a table for further analysis.
- ⚖️ The table is sorted in ascending order to align with the data and simplify the process of summarizing the sampling distribution.
- 📋 The script identifies the distinct variance values (0, 0.5, and 60.5) and their corresponding probabilities, simplifying the fractions to represent the probabilities accurately.
- 🧐 The script emphasizes the importance of simplifying fractions to ensure the accuracy of the probability distribution table.
- 📊 After summarizing the sampling distribution, the script moves on to calculate the mean of the sampling distribution of the sample variances, which also results in 24.667.
- 🤔 The final part of the script prompts a discussion on whether the sample variance is an unbiased estimator of the population variance, concluding that it is unbiased since the mean of the sampling distribution matches the population variance.
- 📚 The script concludes with a clarification of the terms 'biased estimator' and 'unbiased estimator,' highlighting the importance of understanding these concepts in statistical analysis.
Q & A
What are the ages of the children surveyed in the study?
-The ages of the children surveyed are 1, 2, and 12.
How many different samples of size n=2 are selected from the population?
-Nine different samples of size n=2 are selected from the population.
What is the population variance of the numbers 1, 2, and 12?
-The population variance of the numbers 1, 2, and 12 is 24.667.
How is the sample variance calculated in the given study?
-The sample variance is calculated by selecting the sample variances from the two columns representing X1 and X2 in the rows, and then computing the variance for each pair.
What are the different sample variances obtained from the nine samples?
-The different sample variances obtained are 0, 0.5, 50, and 60.5.
What are the probabilities associated with each distinct sample variance value?
-The probabilities associated with each distinct sample variance value are: 0 (3/9 or 1/3), 0.5 (2/9), 50 (2/9), and 60.5 (2/9).
How is the mean of the sampling distribution of the sample variance calculated?
-The mean of the sampling distribution of the sample variance is calculated by finding the mean of the column of the sample variances, which is 24.667.
Is the sample variance an unbiased estimator of the population variance?
-Yes, the sample variance is an unbiased estimator of the population variance, as the mean of the sample variance equals the population variance (24.667).
What is the difference between a biased estimator and an unbiased estimator?
-A biased estimator deviates from the true population value, whereas an unbiased estimator does not deviate from the true population parameter.
What steps are involved in summarizing the sampling distribution of the variances?
-The steps involved are: calculating the sample variances for each pair, sorting the table of variances, identifying the distinct variances and their frequencies, and then computing the probabilities for each distinct variance.
Outlines
📊 Statistical Analysis of Children's Ages
The script discusses a statistical exercise involving the ages of three children: 1, 2, and 12 years old. The task is to analyze the variance of samples drawn from this population. The script explains how to use a statistical software called Stat Crunch to calculate the population variance and the variance of individual samples. It details the process of entering data, calculating the unadjusted variance (population variance), and finding the sample variances for nine different samples. The final step is to round the calculated population variance to three decimal places, which is shown to be 24.667.
📈 Sampling Distribution of Variances and Estimator Bias
This paragraph continues the statistical analysis, focusing on the sampling distribution of variances. It describes how to organize the variances of nine samples into a table, showing the probability distribution of distinct variance values. The script guides through the process of identifying the number of occurrences for each variance value and calculating the corresponding probabilities as fractions, which are then simplified. The mean of the sampling distribution of sample variances is calculated and compared to the population variance to determine if the sample variance is an unbiased estimator. The conclusion is that since the mean of the sampling distribution equals the population variance, the sample variance is an unbiased estimator of the population variance.
Mindmap
Keywords
💡Randomly Selected
💡Samples of Size n
💡With Replacement
💡Population Variance
💡Unadjusted Variance
💡Sampling Distribution
💡Probability Distribution
💡Sample Variance
💡Mean of Sampling Distribution
💡Biased Estimator
💡Unbiased Estimator
Highlights
Three children with ages 1, 2, and 12 are surveyed to understand population variance.
Samples of size n=2 are randomly selected with replacement from the population.
Nine different samples are listed for analysis in StatCrunch software.
A new column for population variance is created with values 1, 2, and 12.
Population variance is calculated using the unadjusted variance method in StatCrunch.
Population variance is found to be 24.667, rounded to three decimal places.
Variance of each of the nine samples needs to be calculated.
Samples are analyzed row-wise to find their variances in StatCrunch.
Sample variances are distinguished and sorted in ascending order.
A table is created to summarize the sampling distribution of variances.
The probability distribution table is formatted with distinct variance values and their probabilities.
Zero variance occurs three times out of nine, with a simplified probability of 1/3.
Variance value 0.5 occurs twice, with a probability of 2/9.
Variance value 60.5 also occurs twice, sharing the same probability of 2/9.
The mean of the sampling distribution of sample variances is calculated.
The mean of sample variances matches the population variance, indicating an unbiased estimator.
The concept of biased versus unbiased estimators is explained in the context of the results.
The conclusion is that the sample variance is an unbiased estimator of the population variance.
Transcripts
Browse More Related Video
[6.3.7] Creating a variance sampling distribution probability distribution table in StatCrunch

6.3.4 Sampling Distribution and Estimators - Sampling Distribution of Sample Variance
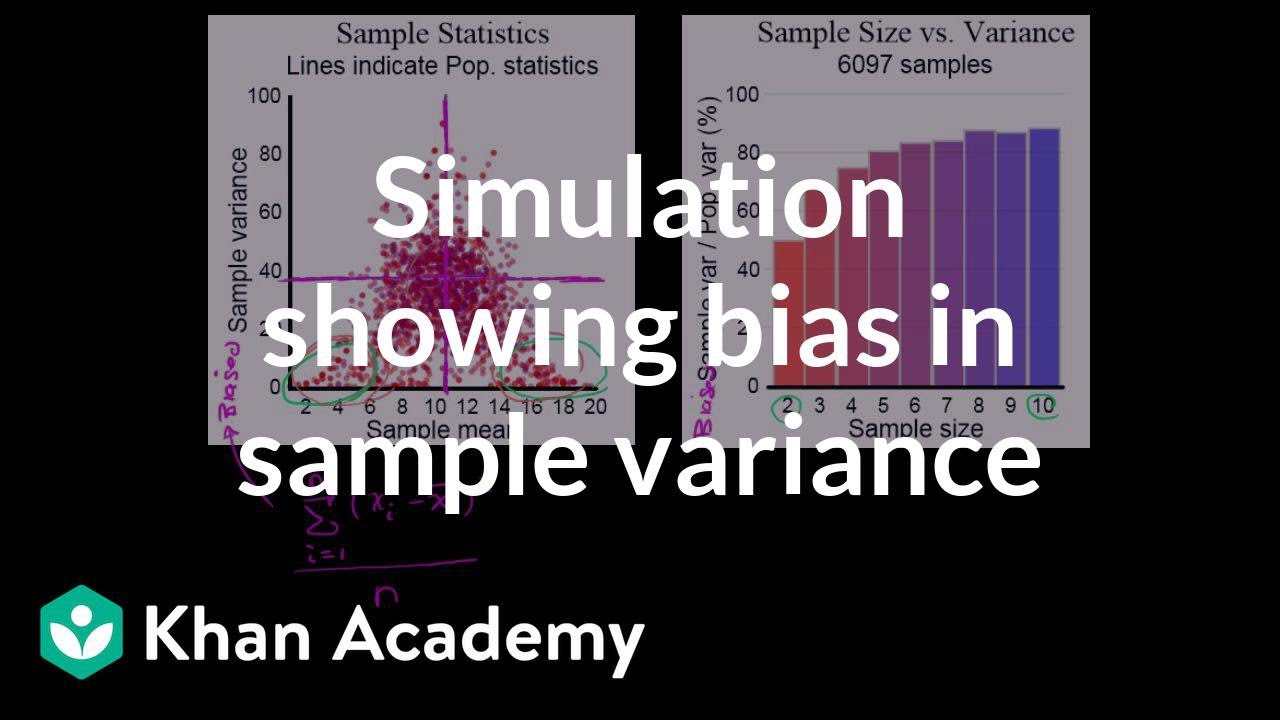
Simulation showing bias in sample variance | Probability and Statistics | Khan Academy
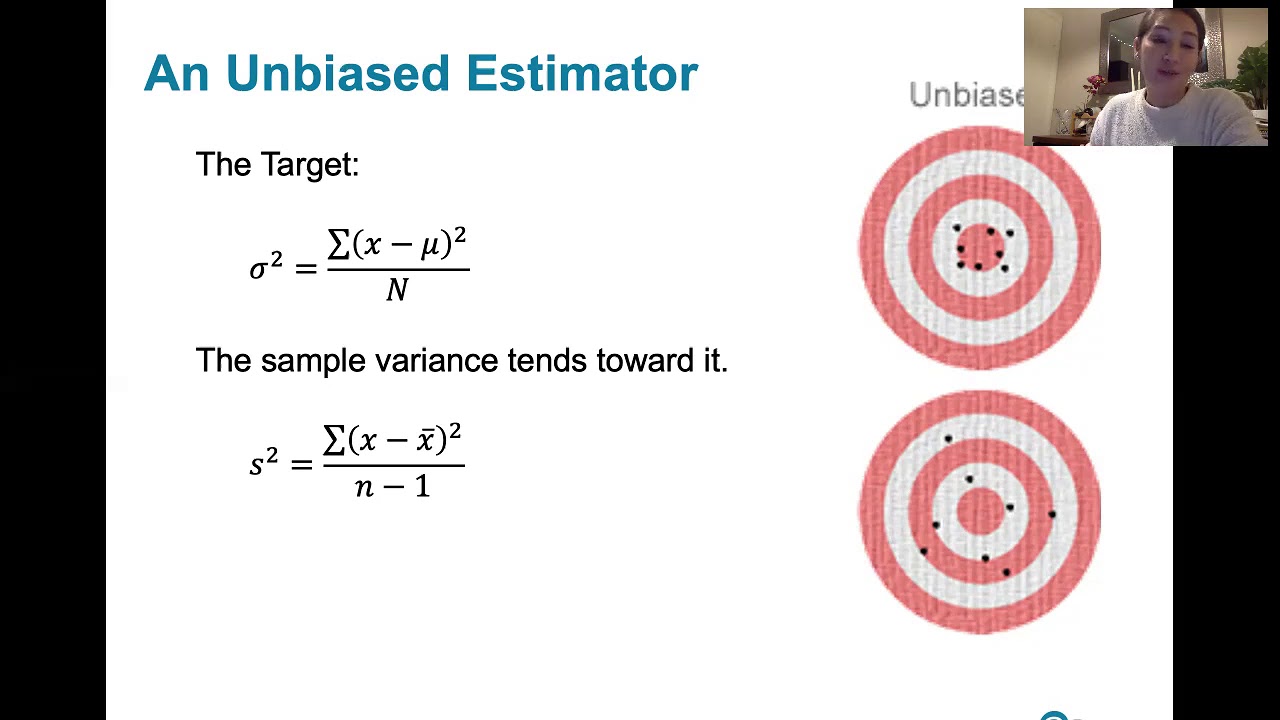
6.3.5 Sampling Distributions and Estimators - Biased and Unbiased Estimators
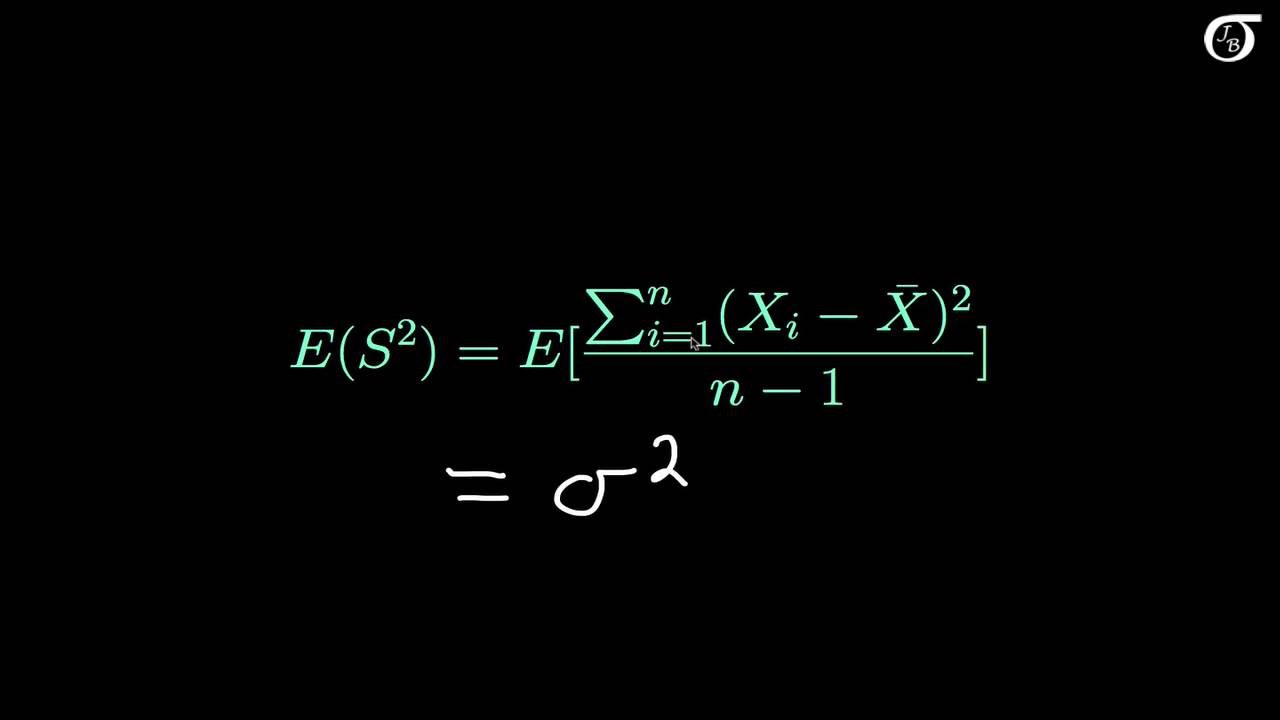
Proof that the Sample Variance is an Unbiased Estimator of the Population Variance
The Sample Variance: Why Divide by n-1?
5.0 / 5 (0 votes)
Thanks for rating: