Finding a confidence interval given summary sample data
TLDRIn this informative video, Professor Curtis from Aspire Mountain Academy offers a comprehensive guide on how to calculate a confidence interval using summary sample data. The video begins with an explanation of expressing a confidence interval with the less than symbol and emphasizes the importance of understanding the data provided. It then moves on to identifying the best point estimate for the population mean, highlighting that the sample mean is an unbiased estimator. The margin of error is also discussed, with a clear method provided for its calculation. The video concludes with a discussion on why it is not necessary to confirm the normal distribution of sample data when constructing a confidence interval, citing the Central Limit Theorem as the reason for treating the distribution of sample means as normal when the sample size exceeds 30. Professor Curtis encourages viewers to engage with the content and seek further assistance through Aspire Mountain Academy if needed.
Takeaways
- 📊 **Confidence Interval Format**: Express confidence intervals using the less than symbol and round to one decimal place for the limits.
- 📈 **Sample Mean as Estimator**: The sample mean (x-bar) is an unbiased estimator for the population mean (mu), making it the best point estimate.
- 🔢 **Margin of Error Calculation**: Calculate the margin of error by subtracting the lower limit of the confidence interval from the point estimate.
- 📉 **Standard Deviation Clarification**: Do not confuse the sample standard deviation (s of X) with the margin of error; they are different.
- 📚 **Central Limit Theorem**: When the sample size is greater than 30, the distribution of sample means can be approximated by a normal distribution due to the central limit theorem.
- ✅ **Random Sample Assumption**: While it's assumed that the sample is random, this doesn't automatically imply a normal distribution of sample means.
- ❌ **Known Sample Standard Deviation**: Knowing the sample standard deviation alone does not justify the use of the normal distribution for constructing a confidence interval.
- ❗ **Population Standard Deviation Unknown**: The population standard deviation is typically unknown, and its knowledge does not determine the sampling distribution's shape.
- 🔴 **Sample Size Requirement**: A sample size of 50 is sufficient to apply the central limit theorem, allowing for the use of the normal distribution in constructing confidence intervals.
- 🎓 **Educational Resource**: Aspire Mountain Academy provides statistics homework help and educational resources for those needing assistance in statistics.
- 💬 **Feedback Encouraged**: Professor Curtis encourages viewers to leave comments for improvement and to engage with the provided educational content.
Q & A
What is the main topic of the video?
-The main topic of the video is teaching how to find a confidence interval given summary sample data in a statistics homework context.
What is the format for expressing the confidence interval as mentioned in Part A?
-The confidence interval should be expressed using the less than symbol and should round to one decimal place around the confidence interval limits.
What is the best point estimate for the population mean (mu)?
-The best point estimate for the population mean (mu) is the sample mean, represented by x-bar, which is an unbiased estimator of the population mean.
How is the margin of error calculated in the context of this video?
-The margin of error is calculated by taking the point estimate (x-bar) and subtracting the lower limit of the confidence interval.
Why is it not necessary to confirm that the sample data appear to be from a population with a normal distribution?
-It is not necessary because, according to the Central Limit Theorem, if the sample size is greater than 30, the distribution of sample means can be treated as a normal distribution, regardless of the population distribution.
What is the significance of the sample size being greater than 30 in the context of constructing a confidence interval?
-When the sample size is greater than 30, the Central Limit Theorem allows us to use the normal distribution as an approximation for the distribution of the data, making it possible to construct a confidence interval.
Why is the sample standard deviation not used as the margin of error?
-The sample standard deviation is a measure of the spread of the data, but the margin of error for a confidence interval is calculated based on the distance between the point estimate and the confidence interval limits, not directly from the standard deviation.
What is the role of the student T distribution in constructing a confidence interval?
-The student T distribution is used when constructing a confidence interval for means, especially when the population standard deviation is unknown, providing a way to estimate the variability in the data.
What is the purpose of the confidence interval in statistics?
-The purpose of a confidence interval is to provide an estimated range within which the population parameter, such as the mean, is likely to fall with a certain level of confidence.
Why does the video emphasize not using statistical software like StatCrunch or Excel to solve the problem?
-The video emphasizes understanding the underlying concepts and calculations involved in finding a confidence interval without relying on statistical software, to ensure a deeper understanding of the process.
What does the Central Limit Theorem state?
-The Central Limit Theorem states that given a sufficiently large sample size from a population with a finite level of variance, the mean of all samples from the same population will be approximately equal to the mean of the population.
How does the video suggest improving the learning experience for statistics?
-The video suggests engaging with the content by asking questions, providing feedback, and seeking additional resources such as lecture videos from Aspire Mountain Academy for a more interactive and comprehensive understanding of statistics.
Outlines
📊 Finding a Confidence Interval from Summary Data
Professor Curtis from Aspire Mountain Academy introduces the topic of finding a confidence interval using summary sample data. The focus is on understanding how to express a confidence interval with the less than symbol and rounding to one decimal place. The professor emphasizes the importance of not relying on statistical software for every problem and instead understanding the underlying concepts. The key elements for constructing a confidence interval are identified: the sample mean (x̄), which serves as the best point estimate for the population mean (μ), and the margin of error, which is calculated by subtracting the lower limit of the confidence interval from the point estimate. The professor also clarifies common misconceptions about the margin of error and the standard deviation of the sample.
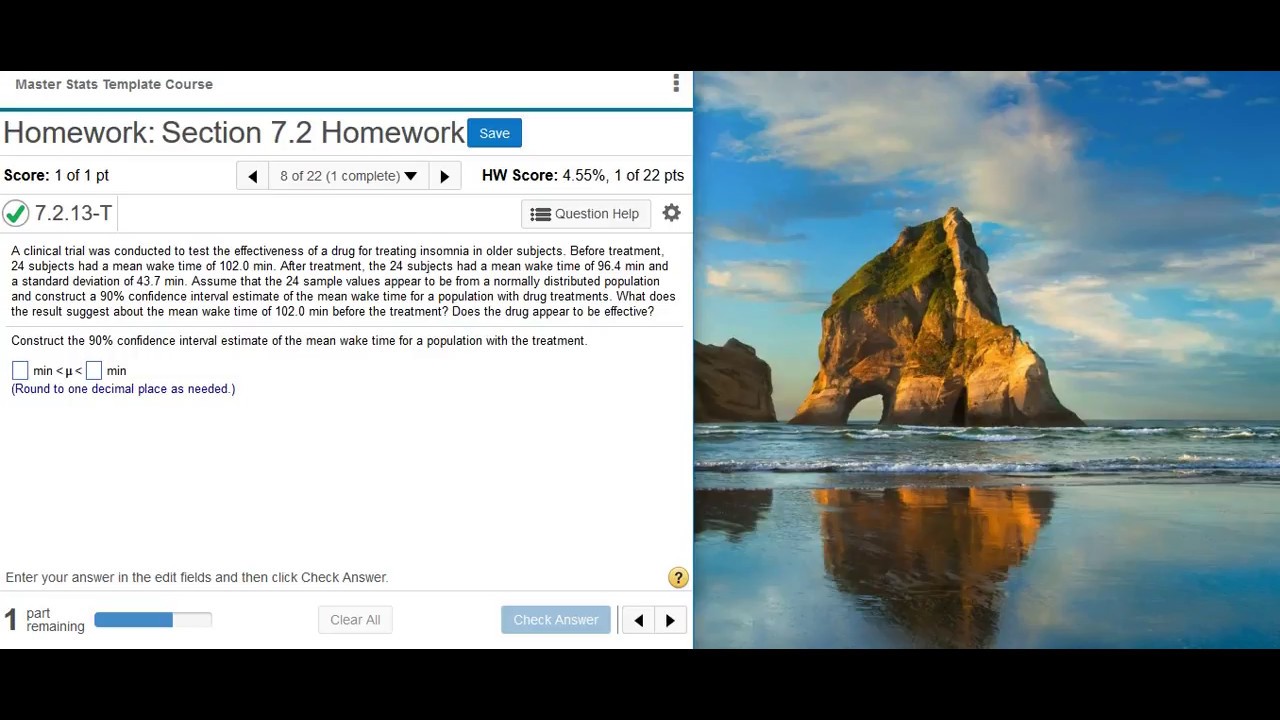
🔍 Understanding the Central Limit Theorem in Confidence Intervals
The second paragraph delves into why it is not necessary to confirm that sample data comes from a normally distributed population when constructing a confidence interval. The professor discusses various answer options, debunking the misconceptions that random sampling, known sample standard deviation, or known population standard deviation are reasons for using the normal distribution. The correct answer is identified as option D, which references the Central Limit Theorem. The theorem states that if the sample size is greater than 30, the distribution of sample means can be approximated by a normal distribution, regardless of the population distribution. The sample size in the given problem is 50, which is greater than 30, thus justifying the use of the normal distribution for the confidence interval. The professor concludes by inviting feedback and comments, and promoting Aspire Mountain Academy for further learning opportunities.
Mindmap
Keywords
💡Confidence Interval
💡Sample Mean (x-bar)
💡Margin of Error
💡Student T Distribution
💡Population Mean (mu)
💡Central Limit Theorem
💡Random Sample
💡Sample Standard Deviation
💡Normal Distribution
💡Point Estimate
💡Statistical Inference
Highlights
Professor Curtis from Aspire Mountain Academy provides statistics homework help.
The lesson focuses on finding a confidence interval given summary sample data.
Part A instructs to express the confidence interval using a less than symbol with one decimal place.
Emphasizes understanding the data display and T interval without relying on external tools like StatCrunch or Excel.
The sample mean (x-bar) is identified as the best point estimate for the population mean (mu).
Margin of error is calculated by subtracting the lower limit from the point estimate.
Discusses the misconception of using the sample standard deviation as the margin of error.
Part C explores why it's not necessary to confirm a normal distribution for the sample data when constructing a confidence interval.
Answer option A is refuted because random sampling does not guarantee a normal distribution of sample means.
Answer option B is incorrect as knowing the sample standard deviation does not inherently use the normal distribution for confidence intervals.
Answer option C is dismissed because knowing the population standard deviation does not dictate the distribution used for data representation.
Answer option D is correct, citing the Central Limit Theorem for sample sizes greater than 30.
The Central Limit Theorem allows the use of the normal distribution as an approximation for the distribution of sample means.
The video concludes with an invitation for feedback and an offer to help students with their statistics learning.
Aspire Mountain Academy is presented as a resource for students who find their statistics teachers unhelpful or unengaging.
Encourages viewers to leave comments and provides a website for further learning resources and lecture videos.
The video ends with a teaser for the next video in the series.
Transcripts
Browse More Related Video
Finding the sample size needed to estimate a confidence interval on a population mean
Finding the best point estimate and confidence interval for proportions
Finding and interpreting a confidence interval for a population mean (σ unknown)

Finding a sample proportion and the corresponding confidence interval

[6.4.6-T] Finding probabilities for different sample sizes using a nonstandard normal distribution
Using StatCrunch to perform hypothesis testing on two matched pair means of acting award ages
5.0 / 5 (0 votes)
Thanks for rating: