8.1.4 Basics of Hypothesis Testing - The Critical Value Method for a Population Proportion
TLDRThis video script outlines the critical value method for testing a claim about a population proportion. It begins with formulating hypotheses and calculating the sample statistic, followed by graphing the sampling distribution. The process involves identifying the type of test, sketching the critical region, finding critical values, and comparing them to the test statistic to decide whether to reject the null hypothesis. The example demonstrates rejecting the null hypothesis when the sample proportion significantly deviates from the hypothesized value, concluding with the interpretation of results in non-technical terms.
Takeaways
- 📝 The script discusses the critical value method for testing a claim about a population proportion, which is a statistical hypothesis testing technique.
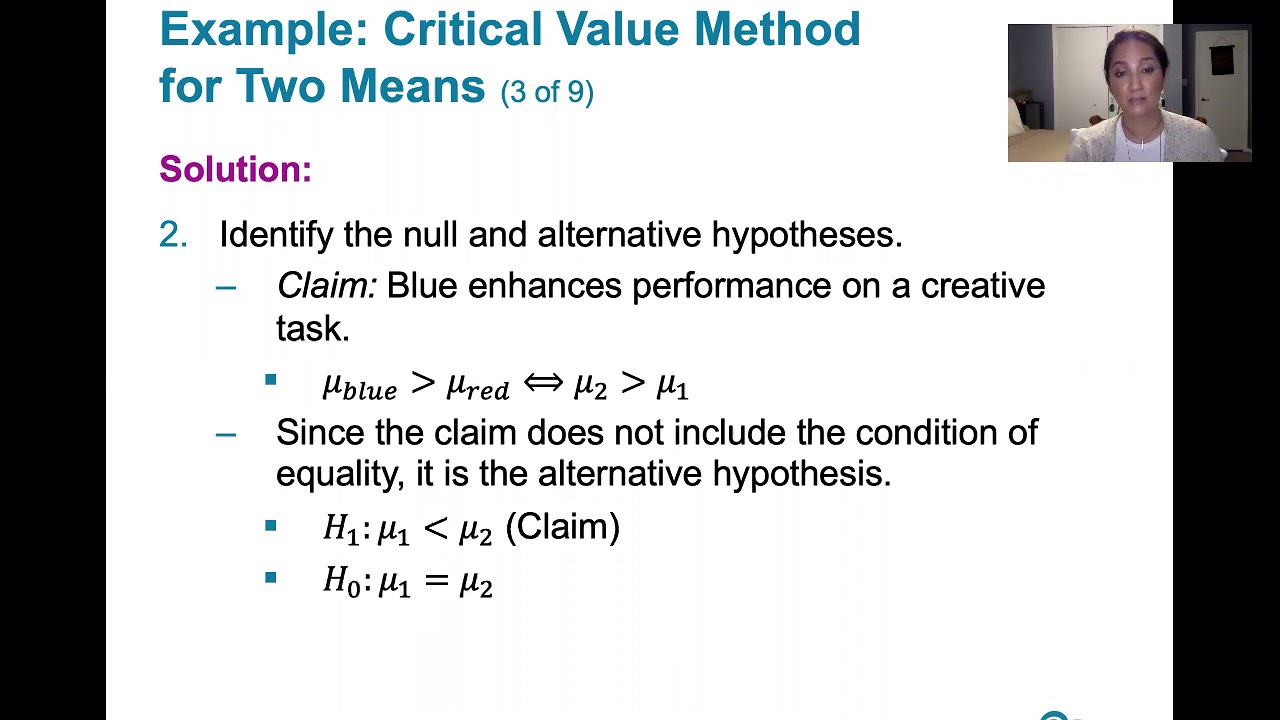
- 🎯 The process of hypothesis testing begins with formulating the null and alternative hypotheses in symbolic form based on the claim.
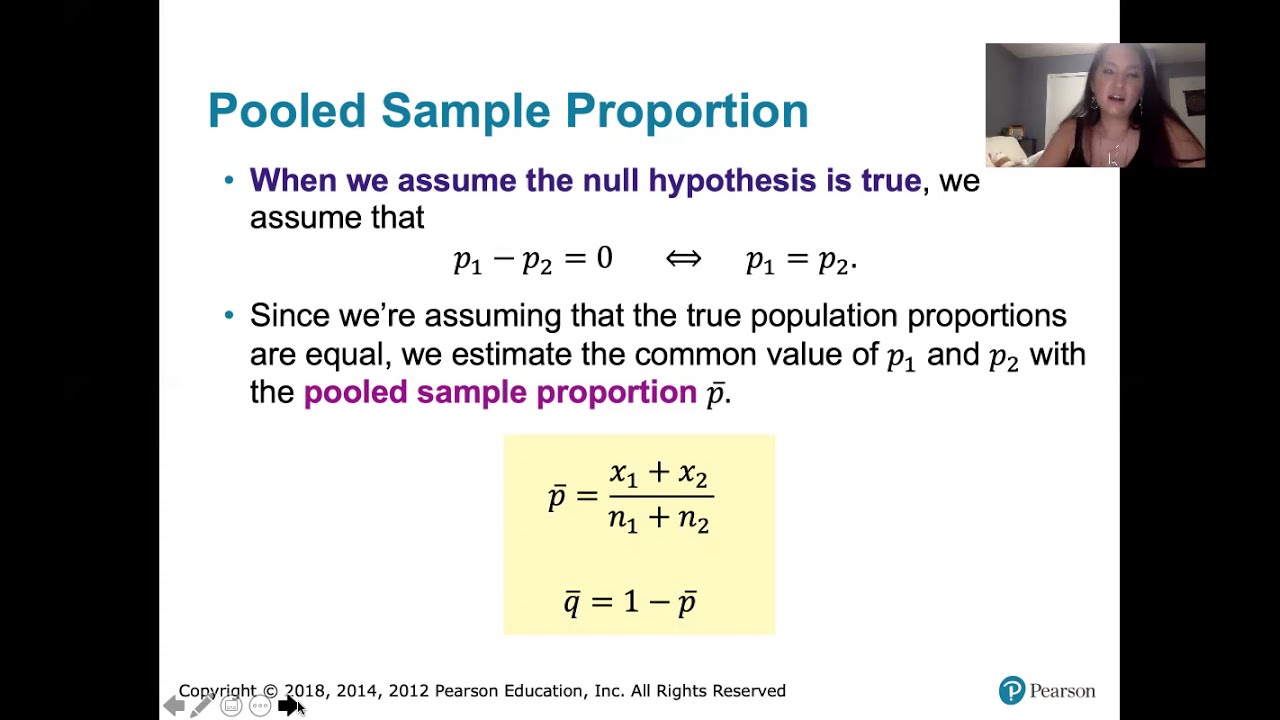
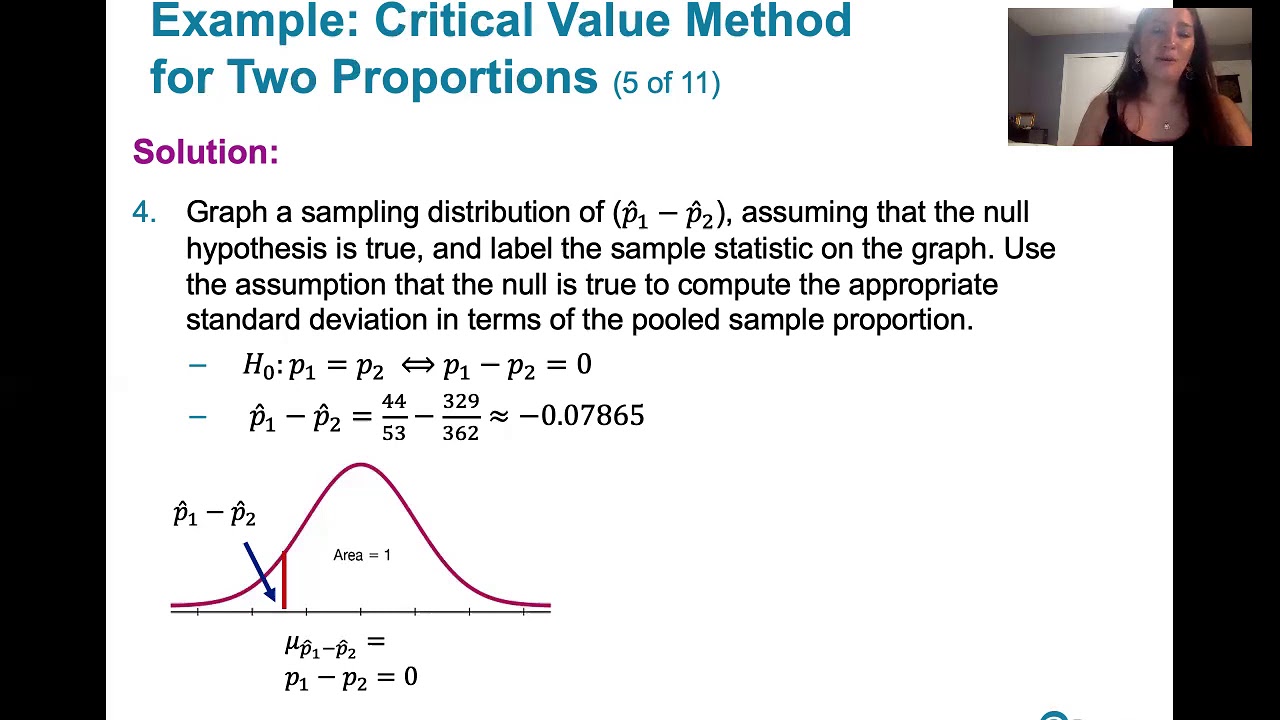
- 📊 It involves identifying the sample statistic, sample size, and graphing the sampling distribution of the sample statistic assuming the null hypothesis is true.
- 📉 The mean of the sampling distribution is used to determine if the sample statistic is extreme or rare, which helps decide whether to reject the null hypothesis.
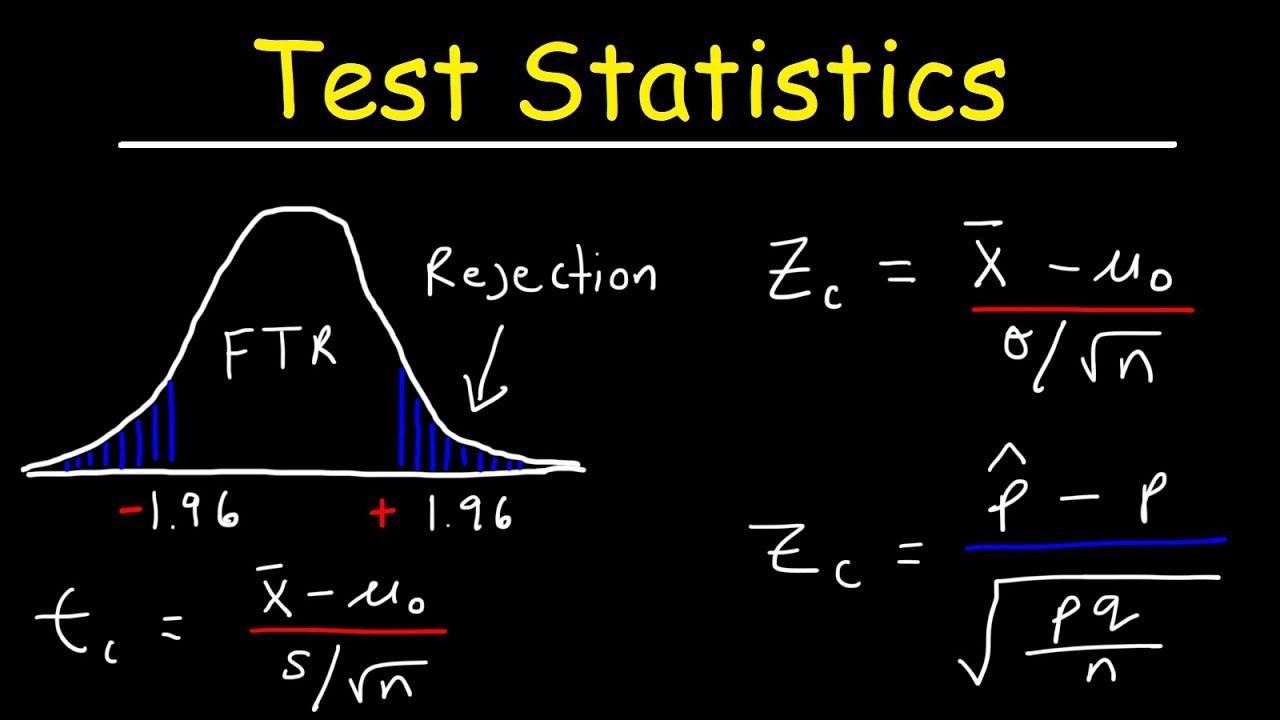
- 🔢 The test statistic is derived from the sample statistic, and it corresponds to a z-score, t-score, or chi-squared value depending on the problem type.
- 🔍 The critical value method requires determining if the test is two-tailed, left-tailed, or right-tailed and sketching the corresponding critical region on the distribution graph.
- 📏 Critical values are the cut-off points on the distribution that separate typical values from significantly high or low values, which are used to decide the hypothesis test outcome.
- 📉 The significance level (alpha) defines the critical region's area, which is split between the tails in a two-tailed test or located in one tail for one-tailed tests.
- 🔑 The decision to reject or not reject the null hypothesis is based on whether the test statistic falls within the critical region, indicating a rare event under the null hypothesis.
- 📝 The conclusion of the hypothesis test is stated in non-technical terms, relating back to the original claim being tested.
- 🚀 The script provides an example of a hypothesis test using the critical value method, demonstrating the process with a specific significance level (alpha = 0.025) and a sample statistic.
Q & A
What is the critical value method used for in statistical hypothesis testing?
-The critical value method is used for testing a claim about a population proportion. It helps to determine whether the sample statistic is significantly high or low, given that the null hypothesis is true, by comparing the test statistic to the critical value.
What are the first steps in the critical value method for hypothesis testing?
-The first steps include writing the claim in symbolic form, inferring the null and alternative hypotheses, identifying the sample statistic, computing it if necessary, and identifying the sample size n.
How is the sampling distribution of the sample statistic used in hypothesis testing?
-The sampling distribution of the sample statistic is used to find the mean of that distribution under the assumption that the null hypothesis is true. This mean serves as a reference point to determine if the sample statistic from the sample is extreme or rare.
What is the difference between a critical value and a test statistic?
-The critical value is a threshold that separates typical values of the sample statistic from those that are significantly high or low. The test statistic is a standardized value that corresponds to the sample statistic and is used to make a decision about the null hypothesis.
What are the types of tests based on the tail of the distribution?
-Tests can be two-tailed, left-tailed, or right-tailed. Two-tailed tests consider both ends of the distribution, left-tailed tests focus on the left end, and right-tailed tests focus on the right end.
How is the significance level (alpha) used in the critical value method?
-The significance level (alpha) is used to determine the area in the tails of the distribution that represents the critical region. This region is where the test statistic must fall to reject the null hypothesis.
What is the rare event rule in inferential statistics?
-The rare event rule states that if the occurrence of the sample statistic is very unlikely given that the null hypothesis is true, but it has occurred, then the null hypothesis is likely to be false and should be rejected.
What is the purpose of the critical region in hypothesis testing?
-The critical region, also known as the rejection region, is the area under the distribution where the test statistic must fall for the null hypothesis to be rejected. It corresponds to all values of the test statistic that are significantly high or low.
How do you determine if a test is left-tailed, right-tailed, or two-tailed?
-The test type is determined by the alternative hypothesis. If the alternative hypothesis includes a less than sign, it's a left-tailed test. If it includes a greater than sign, it's a right-tailed test. If it includes not equal to, it's a two-tailed test.
What is the conclusion of the hypothesis test about personal online data in the script?
-The conclusion is that the sample evidence suggests rejecting the null hypothesis, indicating that the true population proportion is not 0.5, and supports the claim that most adults would erase their personal online information if they could.
Outlines
🔍 Introduction to Hypothesis Testing with the Critical Value Method
The video begins by introducing the process of hypothesis testing, specifically focusing on the critical value method for testing claims about a population proportion. The presenter outlines the initial steps: formulating the null and alternative hypotheses in symbolic form, identifying the sample statistic and size, and graphing the sampling distribution under the assumption that the null hypothesis is true. The goal is to determine if the sample statistic is an extreme or rare event under this assumption. The method then involves converting the sample statistic to a test statistic, such as a z-score, t-score, or chi-squared value, depending on the problem type. The critical value method is introduced, which includes determining the type of test (two-tailed, left-tailed, or right-tailed), sketching and shading the critical region, finding critical values, and making a decision based on whether the test statistic falls within this region. The video promises to define key terms and apply the method through an example.
📊 Understanding Critical Regions and Values in Hypothesis Testing
This paragraph delves deeper into the concept of critical regions and critical values within the context of hypothesis testing. The critical region, also known as the rejection region, is the area under the test statistic distribution that leads to the rejection of the null hypothesis. The paragraph explains how to determine if a test is two-tailed, left-tailed, or right-tailed based on the alternative hypothesis and how this affects the distribution of the significance level (alpha) across the tails. The critical value is the threshold that separates typical values from significantly high or low values. The presenter uses visual aids to illustrate these concepts, explaining how the test statistic corresponds to the sample statistic and how its comparison to the critical value leads to the acceptance or rejection of the null hypothesis.
📉 Hypothesis Testing Procedure and Personal Data Example
The presenter outlines the steps involved in conducting a hypothesis test using the critical value method. This includes stating the original claim, identifying the null and alternative hypotheses, and determining the type of test based on the alternative hypothesis. The example provided involves a claim about the proportion of adults willing to erase their personal online information. The null hypothesis is that the population proportion is 0.5, while the alternative hypothesis is that it is greater than 0.5. The sample statistic is calculated from a sample of 565 adults, with 59 indicating they would erase their information, leading to a sample proportion of 0.59. The presenter discusses the process of graphing the sampling distribution and calculating the test statistic, which in this case is a z-score, to determine how extreme the sample proportion is relative to the assumed population proportion under the null hypothesis.
📝 Calculating the Test Statistic for Sample Proportions
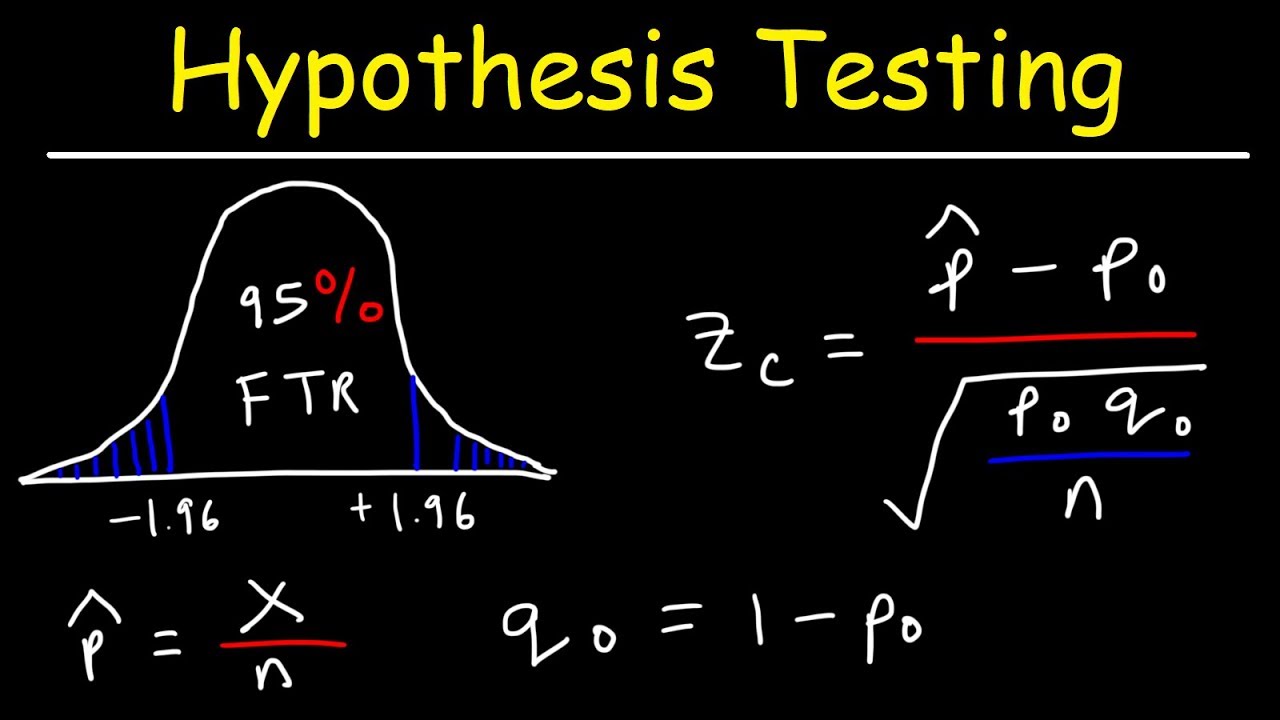
This paragraph focuses on the calculation of the test statistic for sample proportions, using the z-score formula. The presenter explains that the sample proportion (p-hat) is compared to the population proportion assumed in the null hypothesis, divided by the standard deviation of the sample proportions. The calculation involves plugging in the values for the sample proportion, the assumed population proportion, and the sample size to find the z-score. The presenter emphasizes the importance of accurate calculator use to avoid common mistakes in order of operations. The calculated test statistic is then used to assess the extremity of the sample proportion relative to the mean of the sampling distribution, which is assumed to be normally distributed under the null hypothesis.
📉 Decision Making in Hypothesis Testing Using the Critical Value Method
The presenter continues the hypothesis testing process by determining the type of test (in this case, right-tailed) and identifying the critical value associated with the given significance level (alpha = 0.025). The critical z-value is found to be 1.96, which separates typical sample proportions from those that are significantly high. The test statistic, calculated to be 4.29, is compared to this critical value. The presenter demonstrates how to graph the test statistic and make a decision based on its position relative to the critical region. Since the test statistic is far beyond the critical value, the null hypothesis is rejected, indicating that the sample evidence supports the claim that the population proportion is greater than 0.5. The video concludes with a summary of the hypothesis testing process and a preview of the p-value method to be discussed in the next video.
Mindmap
Keywords
💡Critical Value Method
💡Null Hypothesis
💡Alternative Hypothesis
💡Sample Statistic
💡Sampling Distribution
💡Test Statistic
💡Significance Level (alpha)
💡Critical Region
💡Z-Score
💡P-Value Method
Highlights
Introduction to the critical value method for testing a claim about a population proportion.
Explanation of the process starting with writing the claim in symbolic form to infer null and alternative hypotheses.
Identification of sample statistic and sample size n from the problem statement.
Graphing a sampling distribution of the sample statistic assuming the null hypothesis is true.
Determining if the sample statistic from the sample is extreme or unlikely given the null hypothesis.
Transition from sampling distribution to a corresponding distribution using a test statistic.
Decision-making process using critical values and the test statistic.
Defining critical regions and their role in hypothesis testing.
Differentiating between left-tailed, right-tailed, and two-tailed tests.
Calculating and interpreting the test statistic for sample proportions using a z-score.
Using the significance level (alpha) to determine the critical z value.
Graphical representation of the test statistic and its comparison with the critical region.
Decision to reject or fail to reject the null hypothesis based on the test statistic's position relative to the critical value.
Stating the conclusion about the original claim in non-technical terms.
Example application of the critical value method using a personal online data scenario.
Explanation of the calculation of the sample proportion and its significance in the hypothesis test.
Final conclusion that supports the claim that the population proportion is greater than 0.5 based on the sample evidence.
Teaser for the next video on the p-value method as an alternative to the critical value method.
Transcripts
Browse More Related Video
9.2.3 Two Means, Indep. Samples - Critical Value Method, St. Deviations Unknown, Not Assumed Equal
9.1.1 Two Proportions - Rationale Behind Hypothesis Tests Involving Two Proportions
9.1.3 Two Proportions - Example, Critical Value Method, Normal Approximation

Test of Independence Using Chi-Square Distribution
Test Statistic For Means and Population Proportions
Hypothesis Testing - Solving Problems With Proportions
5.0 / 5 (0 votes)
Thanks for rating: