9.1.4 Two Proportions - Confidence Intervals for the Difference Between Two Proportions
TLDRThis video script offers a comprehensive guide on constructing a confidence interval to estimate the difference between two population proportions. It explains the prerequisites for using a normal distribution, the formulation of null and alternative hypotheses, and the rationale behind the confidence interval method. The script delves into the calculation of the margin of error and the decision-making process based on the confidence interval, using an example of comparing accuracy rates between Burger King and McDonald's. It also clarifies the differences between the confidence interval method and the p-value or critical value methods for hypothesis testing, advocating for the use of confidence intervals primarily for estimation rather than hypothesis testing.
Takeaways
- 📚 The video discusses Learning Outcome 4 for Lesson 9.1, focusing on constructing a confidence interval estimate for the difference between two population proportions.
- 🔍 It explains the rationale behind the formulas used in the confidence interval method and the differences between p-value, critical value methods, and the confidence interval method for testing claims about differences in proportions.
- 🎯 The prerequisites for using a normal distribution as an approximation are outlined, including the need for simple random samples, independence of samples, and a minimum of five successes and failures in both samples.
- ⚠️ The importance of stating null and alternative hypotheses in a hypothesis test is emphasized, with the null hypothesis typically representing the equality of proportions and the alternative representing the inequality.
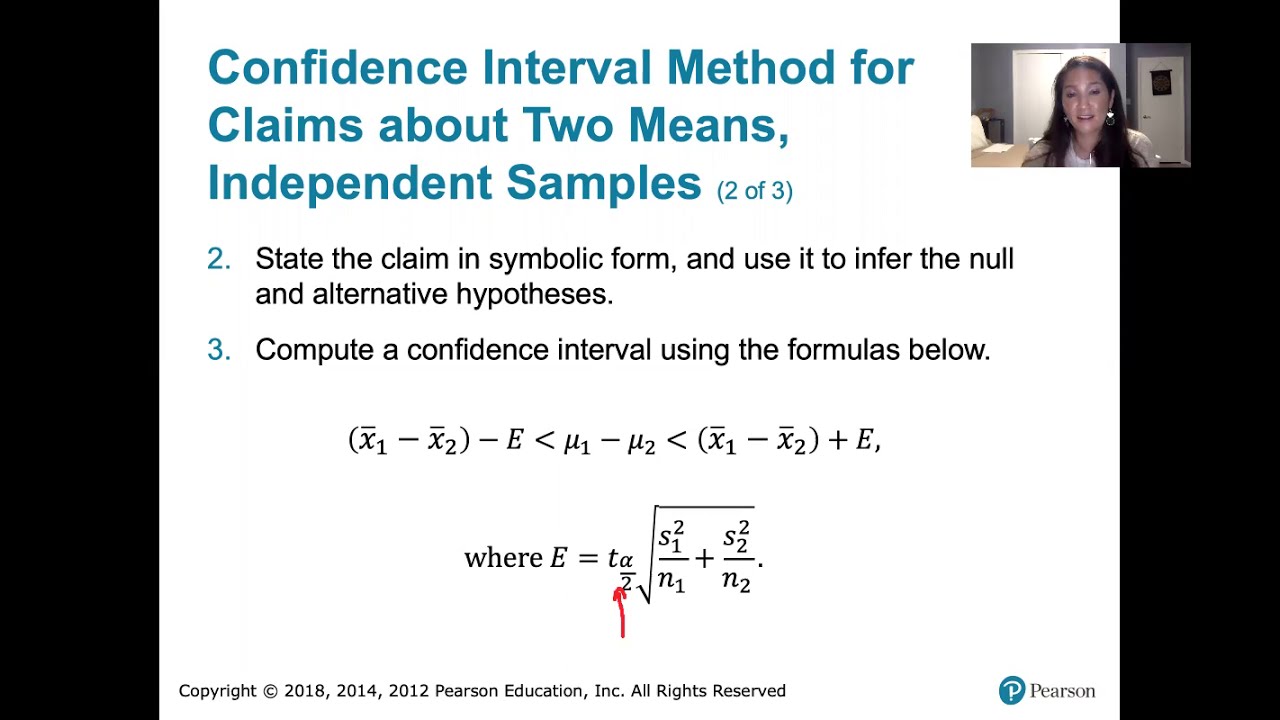
- 📉 The formula for the confidence interval for the difference between two proportions is presented, highlighting the point estimate and the margin of error components.
- 📊 The margin of error is calculated using a factor based on the confidence level (z-score) and an estimate of the standard deviation of the distribution of the difference between the sample proportions.
- 🔢 The video clarifies that the standard deviation formula for the confidence interval method differs from that used in the p-value and critical value methods due to different assumptions about the relationship between the proportions.
- 🤔 The decision to reject or fail to reject the null hypothesis is based on whether zero is included in the confidence interval, with zero's exclusion suggesting the proportions are different.
- 🍔 An example using Burger King and McDonald's drive-through order accuracy rates illustrates the application of the confidence interval method.
- 📉 The video concludes that while confidence intervals can be used to test hypotheses, they are more appropriately used for estimating differences between proportions, with p-value and critical value methods recommended for hypothesis testing.
- 📝 The script advises caution as the confidence interval method may yield different results compared to the p-value and critical value methods due to the different standard deviation estimates used.
Q & A
What is the main topic of the video script?
-The main topic of the video script is constructing a confidence interval estimate of the difference between two population proportions and understanding the rationale behind the formulas, as well as the difference between the p-value and critical value methods and the confidence interval method for testing a claim about the difference between two proportions.
What are the requirements for using a normal distribution as an approximation to the binomial distribution in this context?
-The requirements are that the sample data must form a simple random sample, the samples must be independent with no natural pairing or matching between values in one sample and the other, and there must be at least five successes and five failures in both samples.
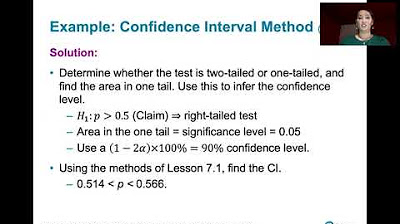
What are the steps to state the null and alternative hypotheses in the context of this video?
-First, state the claim symbolically. Then, determine what's true if the claim isn't true. The statement without the condition of equality is the alternative hypothesis. The null hypothesis is the same as the alternative hypothesis but with the sign changed to an equal sign.
How is the point estimate of the difference between two population proportions calculated?
-The point estimate is calculated by subtracting the sample proportion of the second population (p2 hat) from the sample proportion of the first population (p1 hat).
What is the margin of error in the context of a confidence interval, and how is it used?
-The margin of error is a measure of the variability or uncertainty associated with the point estimate. It is used to construct a confidence interval by adding and subtracting it from the point estimate to give a range within which the true population parameter is likely to fall.
Why is it important to check whether the requirements for a normal distribution approximation are met before constructing a confidence interval?
-It is important to ensure that the approximation is valid and that the assumptions behind the use of the normal distribution are satisfied. This helps to ensure the accuracy and reliability of the confidence interval estimate.
How does the confidence interval method differ from the p-value and critical value methods when testing a claim about the difference between two proportions?
-The confidence interval method does not assume the null hypothesis is true and uses the sample proportions (p1 hat and p2 hat) as estimates for the population proportions. In contrast, the p-value and critical value methods assume the null hypothesis is true and use the pooled sample proportion (p bar) as an estimate for both population proportions.
What is the rationale for using the pooled sample proportion (p bar) in the p-value and critical value methods?
-The pooled sample proportion is used because when assuming the null hypothesis is true, which states that both population proportions are equal, the best estimate for their common value is the pooled sample proportion, which combines information from both samples.
What decision is made about the null hypothesis if the value 0 is within the confidence interval?
-If the value 0 is within the confidence interval, it suggests that the difference between the two proportions might be zero, indicating that the null hypothesis (that the proportions are equal) might be true, so we would fail to reject the null hypothesis.
What conclusion is drawn if the value 0 is not within the confidence interval?
-If the value 0 is not within the confidence interval, it suggests that the null hypothesis is unlikely to be true, indicating that there is a significant difference between the two proportions, leading to the rejection of the null hypothesis.
Why might the confidence interval method not be the best choice for testing a hypothesis about two proportions?
-The confidence interval method might not be the best choice for testing a hypothesis because it is primarily designed for estimating the difference between two proportions rather than testing a hypothesis about their equality. It does not assume the null hypothesis is true and thus may yield different results compared to the p-value and critical value methods, which are specifically designed for hypothesis testing.
Outlines
📊 Introduction to Confidence Intervals for Proportions
This paragraph introduces the concept of constructing a confidence interval to estimate the difference between two population proportions. It outlines the prerequisites for using a normal distribution as an approximation, including the need for simple random samples, independence of samples, and a minimum of five successes and failures in each sample. The paragraph also explains the process of formulating null and alternative hypotheses in the context of testing claims about population proportions.
🔍 Understanding Confidence Intervals and Hypothesis Testing
The second paragraph delves into the specifics of creating a confidence interval for the difference between two proportions, emphasizing the importance of checking the conditions for a normal approximation. It discusses the symbolic representation of null and alternative hypotheses and the rationale behind choosing them. The paragraph also explains the components of the confidence interval formula, including the point estimate, margin of error, and the significance of the confidence level in determining the interval.
📚 Example Application of Confidence Interval Method
This paragraph presents a practical example of applying the confidence interval method to compare the accuracy rates of Burger King and McDonald's drive-through orders. It begins by verifying the conditions for the method's application, such as the independence and random nature of the samples. The paragraph then demonstrates how to calculate the point estimate for the difference in proportions and the margin of error, which is crucial for constructing the confidence interval.
🧮 Calculating the Margin of Error and Confidence Interval
The fourth paragraph focuses on the calculation of the margin of error and the subsequent construction of the confidence interval. It explains the significance of the z-score in relation to the chosen confidence level and how to determine this value using statistical tables or software like Excel. The paragraph also details the process of estimating the standard deviation and its role in calculating the margin of error.
🔢 Using Excel for Standard Deviation and Confidence Interval Calculations
This paragraph demonstrates the use of Excel for calculating the estimated standard deviation and margin of error, which are essential components of the confidence interval. It provides a step-by-step guide on setting up an Excel spreadsheet to compute these values accurately, emphasizing the importance of correct formula entry and the use of Excel functions to facilitate the calculations.
📉 Interpreting the Confidence Interval for Hypothesis Testing
The sixth paragraph discusses the interpretation of the confidence interval in the context of hypothesis testing. It explains how the inclusion or exclusion of zero within the interval leads to the decision to reject or fail to reject the null hypothesis. The paragraph also highlights the information provided by the confidence interval about the relative accuracy rates of the two fast-food chains, suggesting that McDonald's has a higher order accuracy rate than Burger King.
📝 Conclusions and Recommendations for Statistical Methods
In the final paragraph, the script wraps up by contrasting the confidence interval method with the p-value and critical value methods for hypothesis testing. It emphasizes that the confidence interval method is not equivalent to the other two due to differences in estimating the standard deviation. The paragraph advises using the p-value or critical value method for testing hypotheses and reserving the confidence interval method for estimating differences between proportions, aligning with their intended statistical purposes.
Mindmap
Keywords
💡Confidence Interval
💡Population Proportions
💡Normal Distribution Approximation
💡Simple Random Sample
💡Independence
💡Hypothesis Testing
💡Null Hypothesis
💡Alternative Hypothesis
💡Margin of Error
💡Pooled Sample Proportion
💡Significance Level
Highlights
Learning outcome four for lesson 9.1 involves constructing a confidence interval estimate of the difference between two population proportions.
The rationale behind the formulas for constructing confidence intervals is discussed, including the difference between p-value and critical value methods and the confidence interval method.
Requirements for using a normal distribution as an approximation to the binomial distribution are outlined, including the need for simple random samples, independence, and a minimum of five successes and failures in both samples.
Null and alternative hypotheses are defined in the context of hypothesis testing, with the process of deriving them from a claim explained.
The formula for the confidence interval for the difference between two proportions is introduced, highlighting its similarity to previous intervals for population proportions and means.
The importance of computing the margin of error in creating a confidence interval is emphasized, with its dependence on sample size, proportion estimates, and the confidence level.
The process of estimating the standard deviation of the distribution of p1 hat minus p2 hat is detailed, including the substitution of unknown values with point estimates.
Differences between the standard deviation formulas used in the p-value and critical value methods versus the confidence interval method are discussed.
The decision-making process using the confidence interval to test the null hypothesis is explained, including the implications of zero being within or outside the interval.
An example using Burger King and McDonald's drive-through order accuracy rates illustrates the application of the confidence interval method.
The calculation of the margin of error using z-sub-alpha-over-two and the estimated standard deviation is demonstrated with the example data.
Excel functions are shown as a tool for computing complex statistical values, such as the estimated standard deviation for a confidence interval.
The construction of the confidence interval using the point estimate, margin of error, and the resulting interval limits is shown step by step.
The interpretation of the confidence interval in the context of the hypothesis test is discussed, including the decision to reject or fail to reject the null hypothesis.
The practical conclusion from the confidence interval suggests that McDonald's has a higher order accuracy rate than Burger King, based on the negative difference in proportions.
The distinction between using confidence intervals for estimation versus hypothesis testing is highlighted, with recommendations for appropriate use cases.
The video concludes with advice on choosing between the p-value method, critical value method, and confidence interval method for different statistical scenarios.
Transcripts
Browse More Related Video
8.2.2 Testing a Claim About A Proportion - Confidence Interval Method, Comparison to Other Methods
9.2.4 Two Means, Indep. Samples - Confidence Intervals, St. Deviations Unknown, Not Assumed Equal
9.1.0 Two Proportions - Lesson Overview, Key Concepts, Learning Outcomes
9.2.2 Two Means, Independent Samples - The Rationale Behind The Equivalent Methods, P-value Method
8.2.0 Testing a Claim About a Proportion - Lesson Overview, Learning Outcomes, Key Concepts

Elementary Stats Lesson #20
5.0 / 5 (0 votes)
Thanks for rating: