9.1.2 Two Proportions - Example, P-Value Method, Normal Approximation to the Binomial Distribution
TLDRThis video tutorial explains how to test a claim about two proportions using the p-value method, specifically focusing on a study comparing the accuracy of drive-through orders at Burger King and McDonald's. The example demonstrates identifying null and alternative hypotheses, calculating the test statistic and p-value, and making a decision based on the significance level. It emphasizes using the normal distribution as an approximation to the binomial distribution, verifying sample requirements, and interpreting results to conclude whether Burger King and McDonald's have the same accuracy rates.
Takeaways
- 🍔 The video discusses learning outcome number two of lesson 9.2, focusing on testing a claim about two proportions using the p-value method.
- 📊 The example provided is a study comparing the accuracy rates of Burger King and McDonald's drive-through orders, using a significance level of 0.05.
- 🧐 The hypothesis test requires checking that the samples are simple random samples, independent of each other, and that there are at least five successes and failures in each sample.
- 📝 The null hypothesis (H0) states that the accuracy rates of both fast-food chains are equal, while the alternative hypothesis (H1) suggests they are not.
- 🔍 The test statistic used is a z-score from the standard normal distribution, which is an approximation to the binomial distribution due to the sample size requirements being met.
- ✅ The sample proportions and sizes are calculated for both Burger King and McDonald's, which are crucial for the hypothesis test.
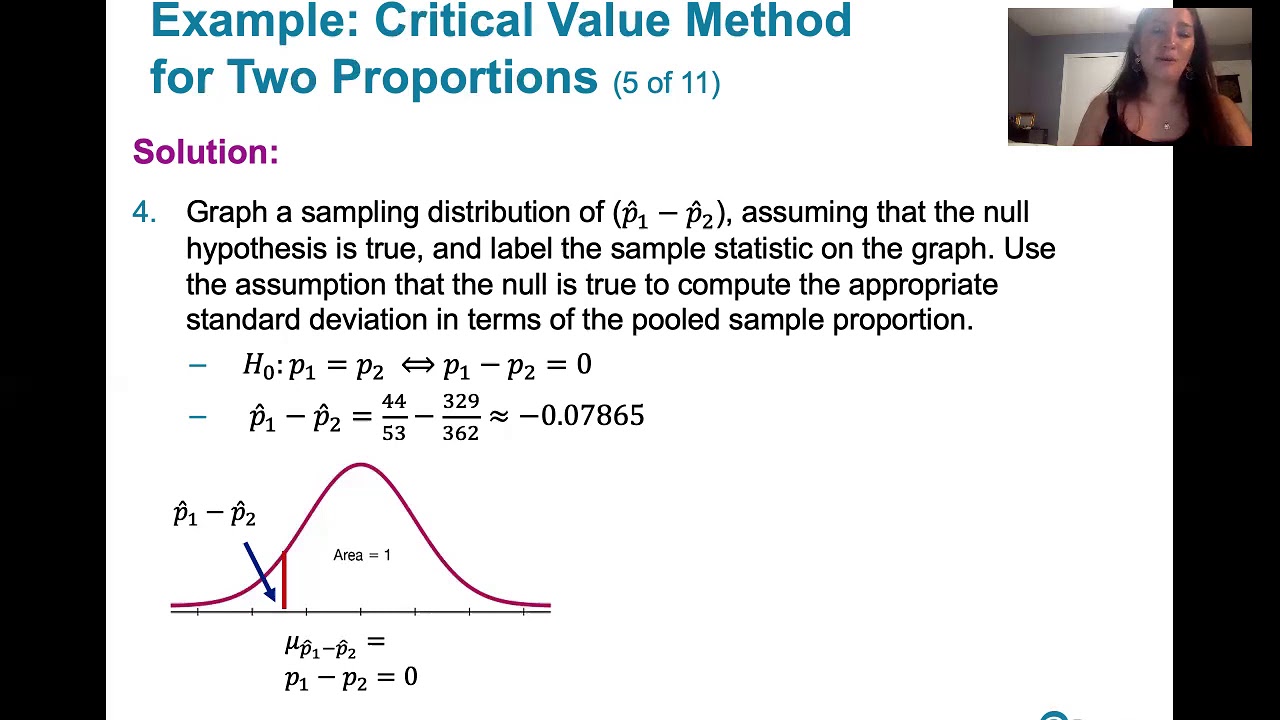
- 📉 A graph of the sampling distribution of the difference in proportions (p1 hat - p2 hat) under the assumption of the null hypothesis being true is recommended for better understanding.
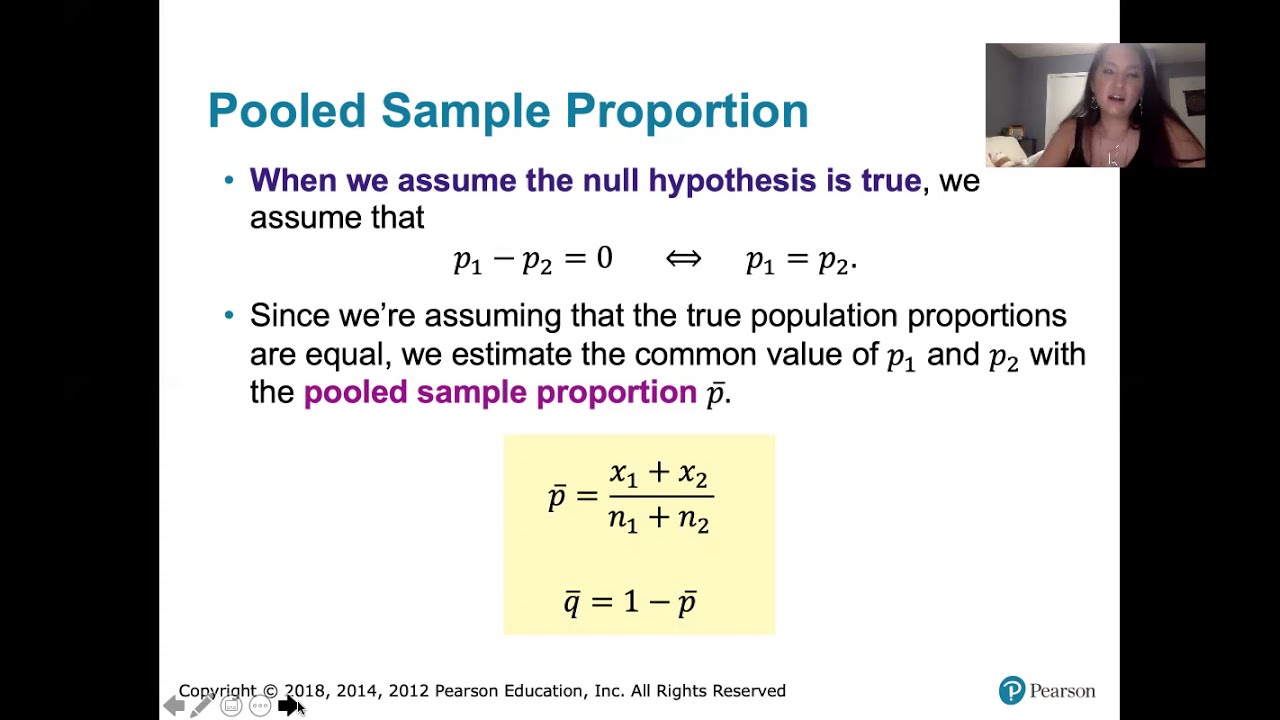
- 🧮 The pooled sample proportion (p bar) is calculated to estimate the standard deviation for the test statistic z, assuming the null hypothesis is true.
- 📊 The test statistic z is computed using the formula involving the sample proportions, their sizes, and the pooled proportion.
- 📈 The p-value, which is the probability of observing the test statistic as extreme as, or more extreme than, the one calculated, is found to be very small (0.0022), indicating strong evidence against the null hypothesis.
- 🚫 The conclusion of the test is to reject the null hypothesis, suggesting there is sufficient evidence that Burger King and McDonald's do not have the same accuracy rates.
Q & A
What is the main topic of the video?
-The main topic of the video is the discussion of learning outcome number two from lesson 9.2, which focuses on testing a claim about two proportions using the p-value method.
What are the two companies involved in the study mentioned in the video?
-The two companies involved in the study are Burger King and McDonald's, and the study is about the accuracy rates of their drive-through orders.
What is the significance level used in the hypothesis test in the video?
-The significance level used in the hypothesis test is 0.05.
What are the requirements for using a normal distribution as an approximation to the binomial distribution in this context?
-The requirements are that the samples are simple random samples, the samples are independent from each other, and there are at least five successes and five failures in each sample.
What are the null and alternative hypotheses for the claim that Burger King and McDonald's have the same accuracy rates?
-The null hypothesis is that the proportion of accurate orders at Burger King (p1) is equal to the proportion of accurate orders at McDonald's (p2). The alternative hypothesis is that p1 is not equal to p2.
How is the pooled sample proportion (p bar) calculated in the video?
-The pooled sample proportion (p bar) is calculated by combining the number of accurate orders from both samples and dividing it by the total number of orders from both samples.
What is the test statistic used in the hypothesis test, and how is it computed?
-The test statistic used is the z-score. It is computed by taking the difference between the sample proportions of accurate orders for Burger King and McDonald's, divided by the estimated standard deviation of the difference.
What does the negative z-score of -3.06 indicate about the difference in accuracy rates between the two companies?
-A negative z-score of -3.06 indicates that the sample proportion of accurate orders for Burger King is approximately 3.06 standard deviations below the mean of the sampling distribution of the difference between the two proportions, assuming there is no actual difference.
How is the p-value calculated in the video, and what does it represent?
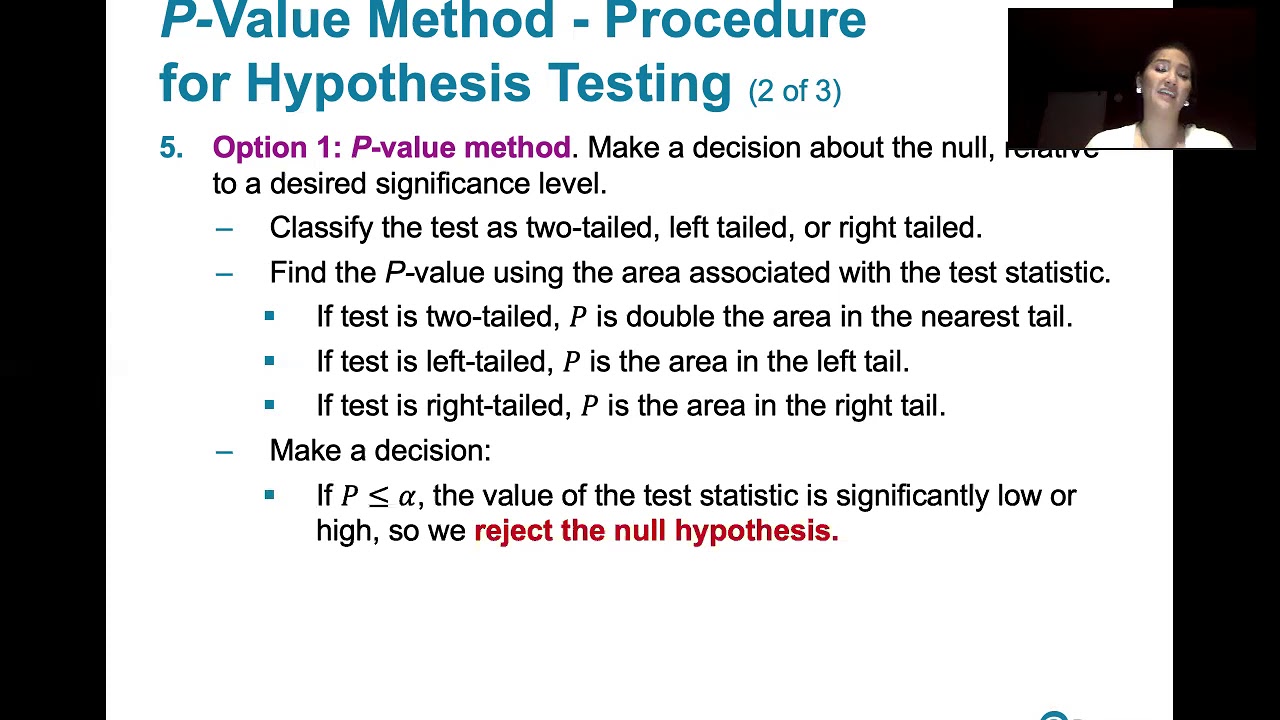
-The p-value is calculated by finding the area to the left of the test statistic (z-score) in the standard normal distribution and then doubling it because it's a two-tailed test. It represents the probability of observing a difference in proportions as extreme as, or more extreme than, the one observed in the sample, assuming the null hypothesis is true.
What conclusion is drawn from the hypothesis test in the video?
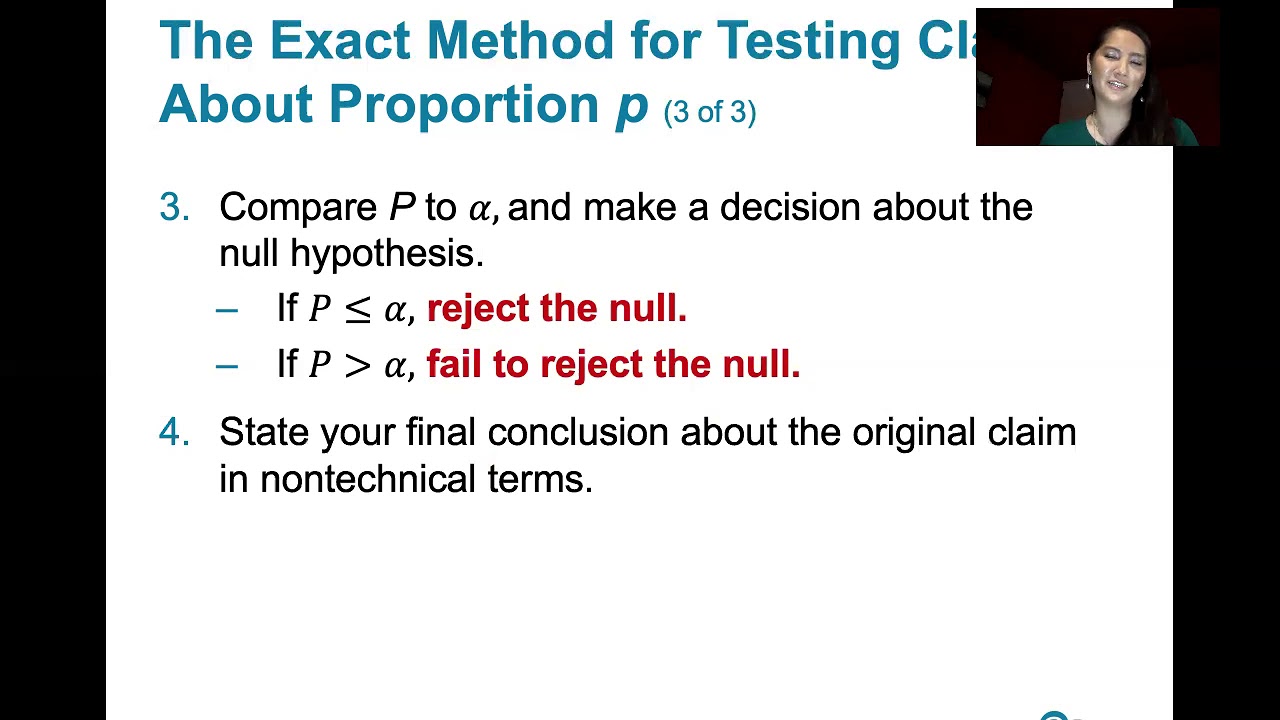
-The conclusion drawn is that there is sufficient evidence to reject the claim that Burger King and McDonald's have the same accuracy rates, based on the p-value being less than the significance level.
How does the video suggest using technology to compute probabilities and p-values?
-The video suggests using Excel to compute probabilities and p-values, as it is more efficient and less prone to calculation errors than manual calculations or using a standard normal distribution table.
Outlines
📊 Hypothesis Testing with P-Value Method
This paragraph introduces the concept of hypothesis testing using the p-value method, focusing on comparing two proportions. The example involves analyzing the accuracy rates of Burger King and McDonald's drive-through orders. The process includes identifying null and alternative hypotheses, computing the test statistic, and finding the p-value. The significance level of 0.05 is used to test the claim that both fast-food chains have the same accuracy rates. The requirements for using a normal distribution as an approximation to the binomial distribution are discussed, ensuring the samples are simple random samples, independent, and have at least five successes and failures.
🔍 Computing Sample Proportions and Sizes
The second paragraph delves into the specifics of computing sample proportions and sizes from the given data. It emphasizes the importance of correctly identifying the sample size as the total number of orders, not just the number of accurate orders. The paragraph illustrates the calculation of proportions for both Burger King and McDonald's, highlighting common mistakes students make. It also introduces the concept of graphing the sampling distribution of the difference between the two sample proportions under the assumption of the null hypothesis being true.
📉 Pooled Proportion and Test Statistic Calculation
This section explains how to calculate the pooled sample proportion, which is crucial for determining the standard deviation used in the hypothesis test. The pooled proportion is derived from combining the successes and sample sizes of both groups. The paragraph also demonstrates how to use Excel to compute the test statistic 'z', which measures the difference between the sample proportions in standard deviation units. The goal is to assess how many standard deviations the observed difference is from what would be expected if the null hypothesis were true.
📈 Determining the P-Value and Test Outcome
The fourth paragraph discusses the process of determining the p-value associated with the computed test statistic 'z'. It explains that the p-value is the probability of observing a test statistic as extreme or more extreme than the one calculated, assuming the null hypothesis is true. The paragraph differentiates between one-tailed and two-tailed tests and shows how to use both Table A2 and Excel to find the p-value. The result is a very small p-value, indicating a rare event under the null hypothesis, which leads to the rejection of the null hypothesis if the p-value is less than the significance level.
🚫 Rejecting the Null Hypothesis and Final Conclusion
The final paragraph concludes the hypothesis test by comparing the calculated p-value to the significance level of 0.05. With a p-value significantly lower than the alpha level, the null hypothesis is rejected, indicating there is enough evidence to suggest that the accuracy rates of Burger King and McDonald's are not the same. The paragraph emphasizes the importance of stating the conclusion in non-technical terms, making it accessible to those without a statistical background. It also previews the next video, which will cover the critical value method, another approach to hypothesis testing.
Mindmap
Keywords
💡Hypothesis Testing
💡P-Value Method
💡Significance Level (Alpha)
💡Null Hypothesis
💡Alternative Hypothesis
💡Test Statistic
💡Z-Score
💡Pooled Sample Proportion (P-Bar)
💡Sampling Distribution
💡Excel
💡Critical Value Method
Highlights
The video discusses learning outcome number two of lesson 9.2, focusing on testing a claim about two proportions using the p-value method.
An example is provided, involving a study of Burger King and McDonald's drive-through orders to test the claim that both have the same accuracy rates.
The significance level of 0.05 is used for the hypothesis test, which is a common threshold in statistical analysis.
The p-value method is chosen over the critical value method for this example, emphasizing its application in hypothesis testing.
Technology, such as Excel, is suggested for computing probabilities, although traditional tables can also be used.
The importance of checking the requirements for the hypothesis test is highlighted, ensuring the validity of the samples and their independence.
The video explains the conditions under which a normal distribution can be used as an approximation to the binomial distribution.
The process of identifying null and alternative hypotheses based on the claim is demonstrated step by step.
Sample proportions and sizes are calculated for both Burger King and McDonald's, crucial for the hypothesis test.
The concept of a pooled sample proportion is introduced to estimate the standard deviation for the test statistic.
Excel is used to demonstrate the computation of the test statistic, emphasizing its utility in statistical analysis.
The test statistic z is calculated, indicating how many standard deviations the sample statistic is from the mean.
The p-value is computed to determine the rarity of the observed sample statistic, given the null hypothesis is true.
The decision to reject the null hypothesis is based on the p-value being less than the significance level.
The final conclusion addresses the original claim in non-technical terms, making the statistical findings accessible.
The video concludes by stating there is sufficient evidence to reject the claim that Burger King and McDonald's have the same accuracy rates.
A comparison between the p-value method and the critical value method is teased for the next video, indicating further educational content.
Transcripts
Browse More Related Video
9.1.3 Two Proportions - Example, Critical Value Method, Normal Approximation
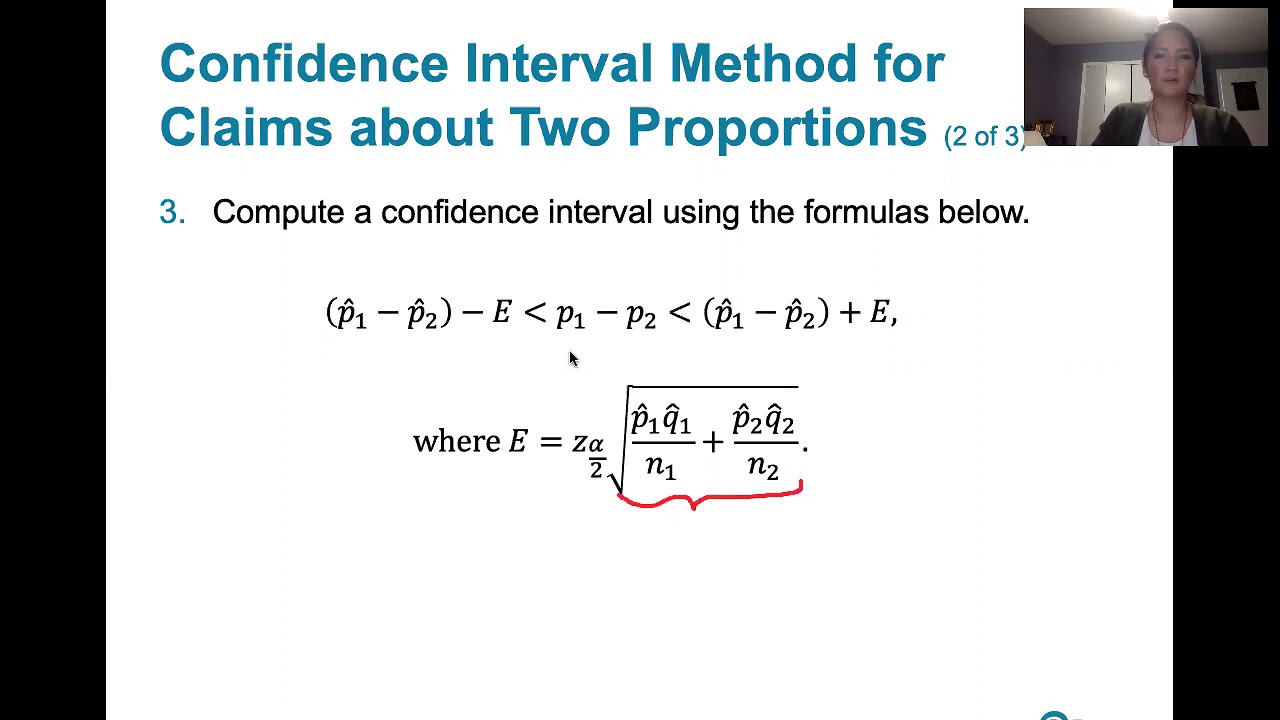
9.1.4 Two Proportions - Confidence Intervals for the Difference Between Two Proportions
8.2.1 Testing a Claim About a Proportion - P-value, Critical Value Methods, Normal Approximation
8.2.3 Testing a Claim About a Proportion - Exact Method Using the Binomial Distribution
10.1.5 Correlation - Testing a Claim of Correlation Using the P-Value Method
9.1.1 Two Proportions - Rationale Behind Hypothesis Tests Involving Two Proportions
5.0 / 5 (0 votes)
Thanks for rating: