Math 119 Chap 7 part 2
TLDRIn this video, we review how to calculate confidence intervals using sample data. The instructor demonstrates step-by-step methods to find a 95% confidence interval for proportions, both by hand and using a calculator. Practical examples include estimating the proportion of women who purchase online books and assessing the importance of appearance in job applicants. The session also covers t-distributions for estimating population means when the standard deviation is unknown, including calculating sample sizes for accurate estimates. Overall, the video emphasizes practical applications of statistics in business and research.
Takeaways
- 📚 The video is a tutorial focused on statistical concepts, specifically confidence intervals for proportions and means.
- 🔢 It covers how to calculate a 95% confidence interval manually using the formula p-hat ± z_{α/2} × √(p-hat(1-p-hat))/n and the error term.
- 📉 The importance of understanding the difference between a sample proportion (p-hat) and the population proportion (p) is emphasized.
- 👩💻 The video demonstrates the use of a calculator to find confidence intervals for a proportion, using the 'one prop z int' function.
- 📈 The tutorial explains the concept of standard error (SE) and its formula, which is the sample standard deviation divided by the square root of the sample size (n).
- 📊 The transition from using z-scores to t-scores is discussed when the population standard deviation is unknown, highlighting the use of the t-distribution.
- 🔍 The script includes an example of calculating the standard error of the mean for a sample of employed adults in New York State.
- 🤔 The concept of 'degrees of freedom' is introduced, explaining its relevance in t-tests and its calculation as n - 1.
- 📝 The video script provides step-by-step instructions for calculating the margin of error and interpreting confidence intervals.
- 🛒 An example from Consumer Reports is used to illustrate the application of confidence intervals in real-world scenarios, such as estimating the average number of calories in vanilla yogurt.
- ⚖️ The tutorial concludes with a discussion on sample size calculations for means when the population standard deviation is unknown, using z-scores for estimation.
Q & A
What is the purpose of a confidence interval in statistics?
-A confidence interval is used to make a prediction about a population parameter based on a sample. It extends the knowledge obtained from a sample to make inferences about the population, providing an estimated range within which the population parameter is likely to fall.
What is the formula for calculating the margin of error in a confidence interval for a proportion?
-The margin of error for a proportion is calculated using the formula: p-hat ± (z * sqrt((p-hat * (1 - p-hat)) / n)), where p-hat is the sample proportion, z is the z-score corresponding to the desired confidence level, and n is the sample size.
What is the critical value for a 95% confidence interval using the z-distribution?
-The critical value for a 95% confidence interval using the z-distribution is 1.96, which corresponds to the z-score that captures 95% of the area under the curve in a standard normal distribution.
How do you calculate the standard error of the mean?
-The standard error of the mean (SEM) is calculated using the formula: SEM = s / sqrt(n), where s is the sample standard deviation and n is the sample size.
What is the difference between a sample proportion (p-hat) and the population proportion (p)?
-The sample proportion (p-hat) is an estimate of the population proportion (p) based on a sample. p-hat is calculated from the sample data, while p is the true proportion in the entire population that we are trying to estimate.
What is the t-distribution and when is it used instead of the z-distribution?
-The t-distribution, also known as Student's t-distribution, is used when the population standard deviation is unknown. It is used instead of the z-distribution for estimating confidence intervals for the mean when the sample size is small and the population distribution is normal or the sample size is larger than 30.
How do you find the degrees of freedom in a statistical problem?
-In the context of estimating a mean, the degrees of freedom is typically the sample size minus one (n - 1). It represents the number of independent pieces of information that contribute to estimating the variance.
What is the formula for calculating the margin of error for a confidence interval of a mean when using the t-distribution?
-The margin of error is calculated as t * (s / sqrt(n)), where t is the t-score corresponding to the desired confidence level and degrees of freedom, s is the sample standard deviation, and n is the sample size.
How can you interpret a confidence interval for a mean in the context of a real-world problem?
-A confidence interval for a mean indicates that we are a certain percentage confident (e.g., 95% or 99%) that the true mean of the population lies within the calculated interval. For example, if the confidence interval for the average time teenagers spend on the internet is between 2.503 and 3.897 hours, we can say that we are 98% confident that the true average time falls within this range.
What assumptions are necessary for constructing a valid confidence interval for a mean?
-To construct a valid confidence interval for a mean, it is assumed that the sample is random, the population distribution is normal or the sample size is large enough (n > 30), and the observations are independent.
How can you calculate the sample size needed for a given margin of error and confidence level when estimating a mean?
-To calculate the sample size needed, you can use the formula: n = (z^2 * s^2) / E^2, where z is the z-score corresponding to the desired confidence level, s is the known standard deviation or an estimate of it, and E is the margin of error.
What is the relationship between the margin of error and the confidence level in a confidence interval?
-The margin of error is inversely related to the confidence level. As the confidence level increases, the margin of error increases, meaning that a higher level of confidence will result in a wider interval to capture the true population parameter.
Can you use the sample standard deviation as an estimate for the population standard deviation when calculating sample size for a mean?
-Yes, when the population standard deviation is unknown, you can often use the sample standard deviation as an estimate. However, this is an approximation and assumes that the sample is representative of the population.
Outlines
📚 Consumer Behavior and Confidence Interval Calculation
The paragraph discusses a follow-up on a statistical problem related to consumer behavior. It explains the concept of a 95% confidence interval using a survey example where 29 out of 427 women purchase online books. The presenter guides through the manual calculation of the confidence interval, introducing the formula for margin of error and the use of z-scores for a 95% confidence level. The process involves calculating the sample proportion (p-hat), determining the error using the z-score (1.96), and finally deriving the confidence interval range. The explanation emphasizes understanding the prediction of the population based on the sample and concludes with the calculated interval of approximately 24.7% to 33.1%.
🔍 Comparing Manual Calculations with Calculator Results
This section compares the manual calculation of a confidence interval with the results obtained using a calculator. The scenario involves a consumer report survey where 29% of 427 women purchase online books. The manual process is briefly touched upon before diving into the calculator approach, which uses the 'one prop z int' function. The video demonstrates how to input the sample size, proportion, and confidence level into the calculator to obtain the interval. The results from manual calculations and the calculator are shown to be very close, highlighting the accuracy and convenience of using a calculator for such statistical analysis.
👔 The Impact of First Impressions in Job Interviews
The paragraph explores the significance of first impressions in job interviews, as reported by a Harris poll of 514 human resource professionals. It states that 90% consider the appearance of a job applicant crucial for a good first impression. The speaker uses this statistic to calculate a 99% confidence interval for the true population proportion, illustrating the process of adjusting for the sample proportion (p-hat) and the quantile (z-score) for the desired confidence level. The manual calculation is shown alongside the potential calculator input, emphasizing the closeness of results between the two methods. The summary underscores the practical application of these statistical findings in business strategies, such as online sales and service promotion.
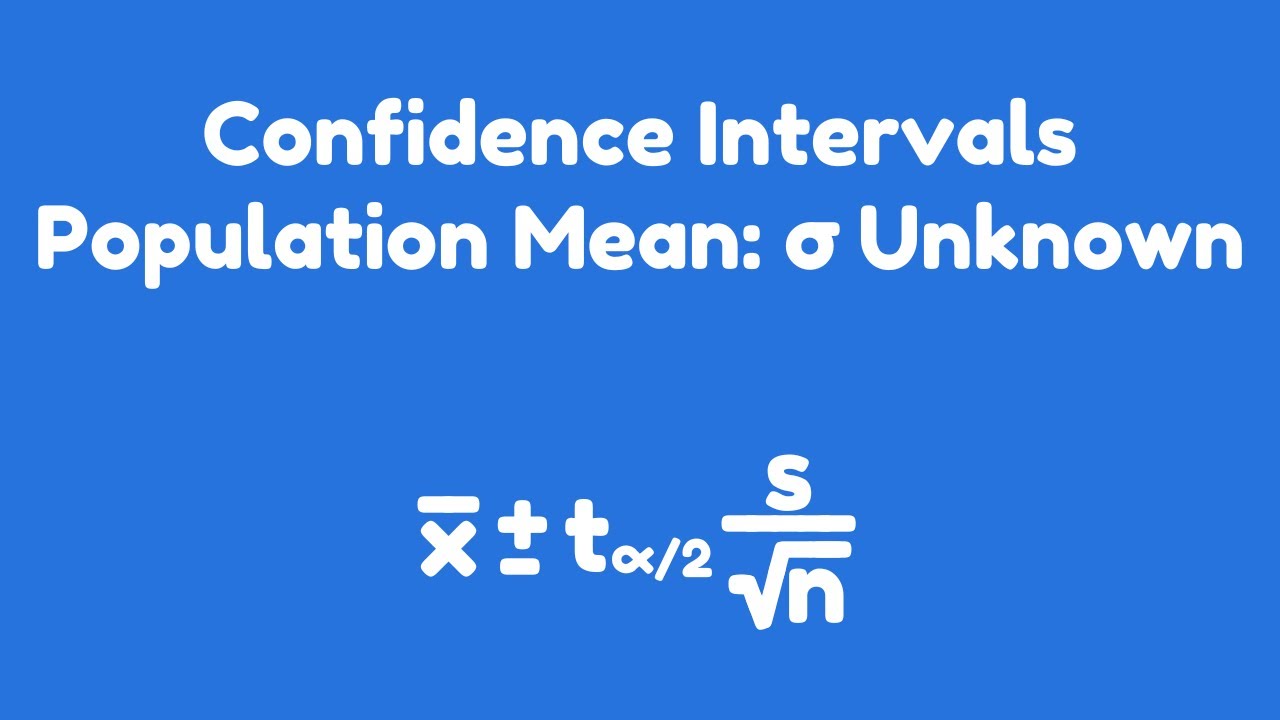
📉 Understanding the T-Distribution and Estimating Population Mean
This section delves into the use of the t-distribution for estimating population means when the population standard deviation is unknown. It contrasts the z-distribution, which requires knowledge of the population standard deviation, with the t-distribution, which is used when this information is lacking. The concept of standard error is introduced, along with its formula and application in calculating the margin of error for a confidence interval. The paragraph also explains the concept of degrees of freedom and how it relates to sample size. An example is provided to calculate the standard error of the mean for the travel time to work for a sample of 20 employed adults in New York State.
📝 Practice with Confidence Intervals and Sample Size Calculations
The paragraph presents a series of statistical problems related to confidence intervals and sample size calculations. It begins with a problem involving teenagers' internet usage, where the assumptions for a valid confidence interval are discussed, including the need for a random sample and normal distribution or a large sample size (n>30). The calculation of the point estimate and standard error is shown, followed by the determination of a 98% confidence interval using the t-distribution. The paragraph also touches on the interpretation of the confidence interval and the use of calculator functions to perform these calculations.
🍨 Consumer Reports and Confidence Intervals for Mean Estimation
This paragraph discusses a scenario where Consumer Reports tests the calorie content of vanilla yogurt from 14 different brands. The data provided is used to create a 95% confidence interval for the mean number of calories per serving, assuming a normal distribution. The process involves using the t-distribution due to the unknown population standard deviation and having a sample size less than 30. The paragraph guides through the steps of using a calculator to input the data, calculate the standard deviation, and determine the confidence interval. It concludes with an interpretation of the interval, which suggests that a diet guide's claim of 120 calories per serving is not supported by the interval.
🍴 Sample Size Calculations for Estimating Means
The final paragraph focuses on sample size calculations for estimating means when the population standard deviation is unknown. It explains the challenge of not knowing the sample size (n) ahead of time and the workaround of using a prior sample standard deviation or a population standard deviation from another group. The paragraph provides formulas and examples for calculating the required sample size to achieve a certain level of confidence and precision in the estimate of the mean. The examples include nutritional content on packaged foods and the production of rubber gaskets, illustrating how to apply these calculations in real-world scenarios.
Mindmap
Keywords
💡Confidence Interval
💡p-hat (p̂)
💡Margin of Error
💡z-score
💡Sample Size (n)
💡Population Proportion
💡Standard Error
💡Degrees of Freedom
💡t-distribution
💡Critical Value
Highlights
Introduction to constructing a 95% confidence interval for a population proportion using sample data.
Explanation of the formula for calculating the margin of error in a confidence interval.
Demonstration of calculating a confidence interval by hand and using a calculator for comparison.
Use of the z-score for a 95% confidence level in the context of a survey about online book purchases.
Conversion of sample proportion to a population estimate through the confidence interval.
The importance of understanding confidence intervals for business decision-making.
Practice of calculating a 99% confidence interval for a population proportion related to job applicant appearances.
Utilization of the t-distribution for estimating population mean when the population standard deviation is unknown.
Concept of standard error and its role in estimating the mean of a population.
Explanation of degrees of freedom and their impact on the choice between z-scores and t-scores.
Construction of a confidence interval for the mean of travel times to work in New York State.
Assumptions required for the validity of a confidence interval for the mean amount of time teenagers spend on the internet.
Interpretation of a confidence interval for the average tip given by patrons at a gourmet restaurant.
Method to calculate the margin of error from a given confidence interval.
Process of back-solving for the critical value and confidence level from a known confidence interval.
Guidance on creating a confidence interval for the mean calories in vanilla yogurt and evaluating a diet claim.
Discussion on sample size calculations for estimating means with a specified level of confidence and margin of error.
Use of prior sample standard deviation as a substitute for unknown population standard deviation in sample size calculations.
Conclusion summarizing the process of working with means, confidence intervals, and sample size calculations in statistics.
Transcripts


5.0 / 5 (0 votes)
Thanks for rating: