Elementary Stats Lesson #4
TLDRThis video lesson delves into descriptive statistics, focusing on measures of position to analyze datasets. It introduces z-scores for standardizing data points and explains their significance in identifying an observation's position relative to the mean. The empirical rule is applied to understand data distribution, and the importance of z-scores in statistical analysis is highlighted. The instructor also covers percentiles, quartiles, and the five-number summary, emphasizing their resistance to outliers and skewness. The video demonstrates how to use a calculator for statistical plots and data summaries, concluding with the significance of resistance in numerical summaries.
Takeaways
- 📊 Descriptive statistics are essential for summarizing and analyzing data sets, and measures of position like z-scores help standardize data points for comparison.
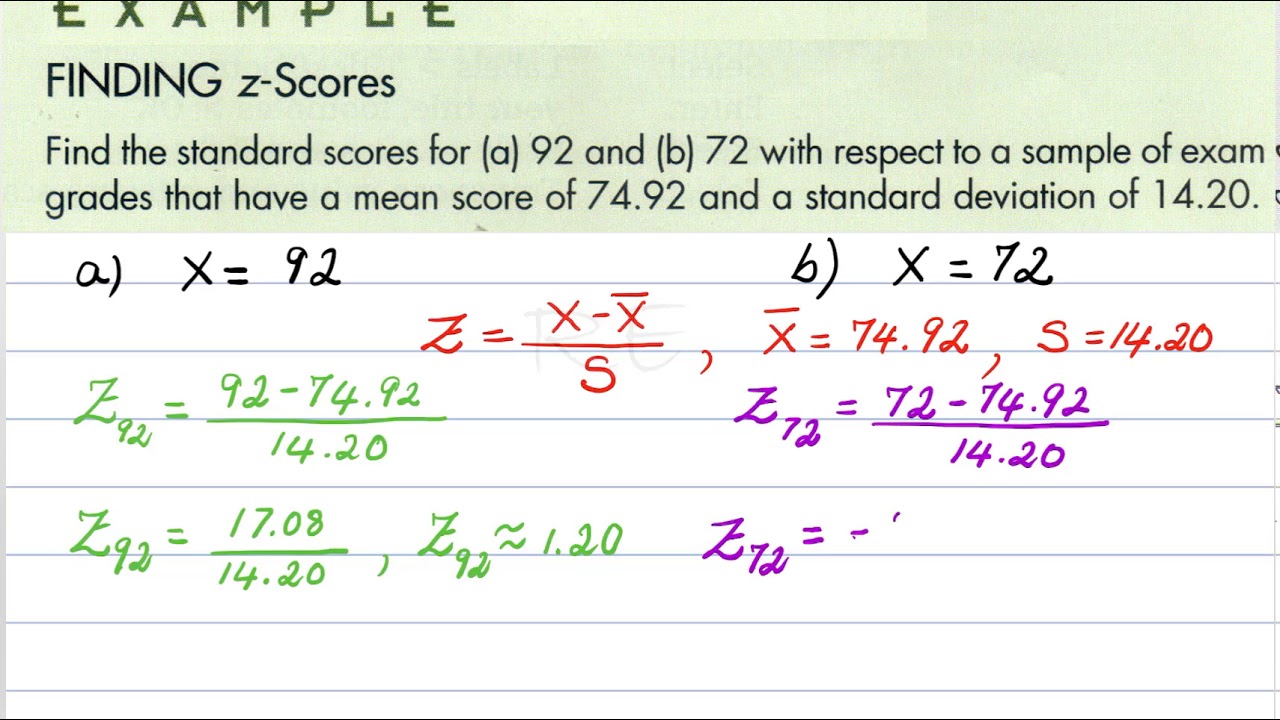
- 🔢 The z-score formula involves subtracting the sample mean from the observation and dividing by the sample standard deviation, indicating how many standard deviations an observation is from the mean.
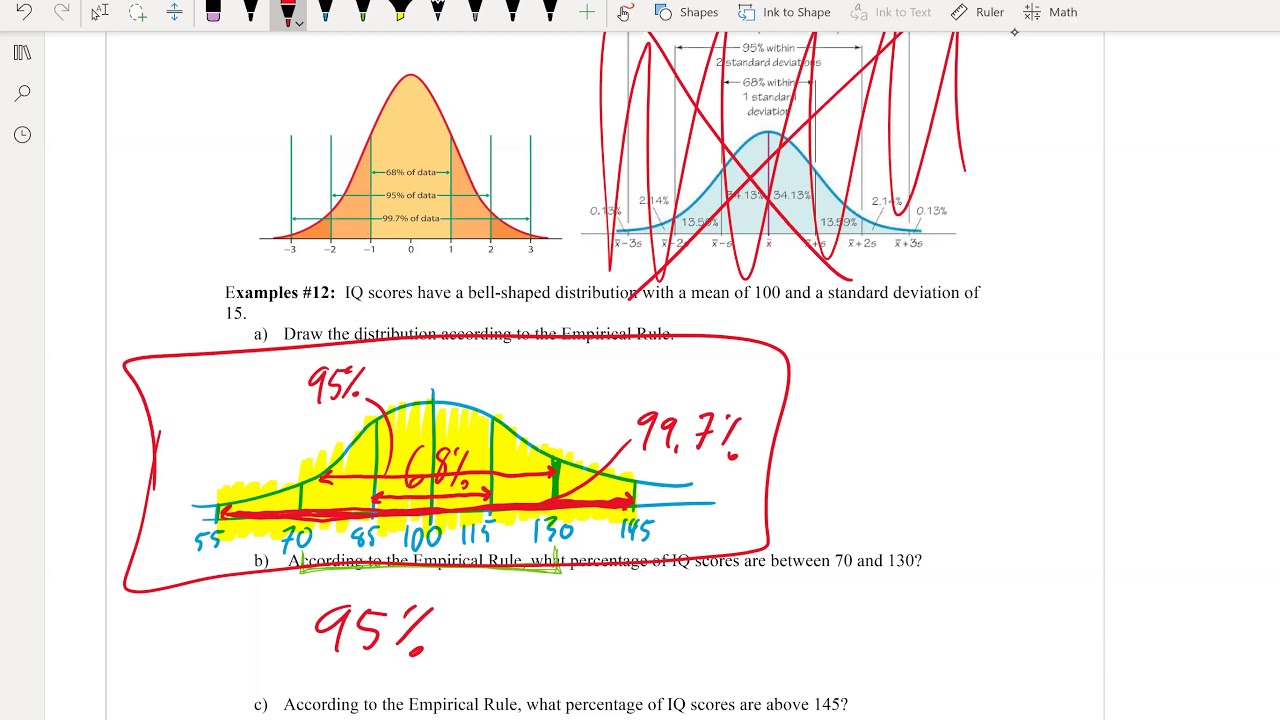
- 📚 The empirical rule is a tool for understanding the distribution of data, stating that for a normal distribution, approximately 68% of data falls within one standard deviation of the mean, 95% within two, and 99.7% within three.
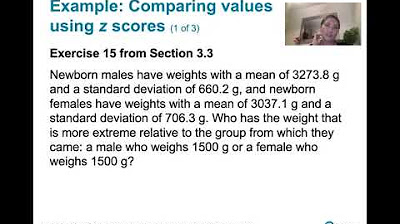
- 📈 Z-scores allow for the comparison of data points from different data sets, standardizing them to a common scale, which is crucial for making relative comparisons like comparing heights of individuals from different populations.
- 🔠 Percentiles and quartiles are measures of position that divide a data set into 100 equal parts and four parts respectively, providing a way to assess the distribution of data relative to specific percentages.
- 📐 The median, as the 50th percentile, is a robust measure of central tendency that is unaffected by extreme values or skewness in the data.
- 📊 Quartiles (Q1, Q2, Q3) and the interquartile range (IQR) are used to identify the spread of the middle 50% of the data and are resistant to outliers, making them reliable measures of spread.
- 🚫 Outliers can distort the mean and standard deviation, so measures like the median and IQR are preferred when outliers are present or when data is skewed.
- 📝 The five-number summary (minimum, Q1, median, Q3, maximum) and the box plot are effective tools for summarizing data, especially when dealing with outliers or skewed distributions.
- 🛠️ Technology, such as the TI-83/84 calculator, can automate the calculation of descriptive statistics and the creation of box plots, simplifying the analysis process for students and researchers.
Q & A
What is the main focus of the second lesson of the second week in the semester?
-The main focus is on descriptive statistics, specifically choosing numbers that describe the position of a particular observation in a data set, referred to as measures of position.
What is a z-score and what does it represent?
-A z-score, also known as a standard score, is a measure that indicates how many standard deviations an observation is from the mean. It is calculated by subtracting the sample mean from the observation value and then dividing by the sample standard deviation.
What is the empirical rule and how does it relate to z-scores?
-The empirical rule is a set of probabilities that describes the distribution of data that is symmetric and bell-shaped. It states that about 68% of the data falls within one standard deviation of the mean, 95% within two standard deviations, and 99.7% within three standard deviations. Z-scores help to identify the position of an observation within these ranges.
Why are z-scores useful in statistical analysis?
-Z-scores are useful because they standardize data points from different data sets, allowing for comparisons between them. They also play a significant role in many statistical processes and inference methods throughout statistical analysis.
How can z-scores be used to compare the relative height of individuals from different populations?
-Z-scores can be used to compare the relative height of individuals by transforming their heights into a standard measurement that accounts for the mean and standard deviation of their respective populations. This allows for a comparison of who is relatively taller within their population.
What is a percentile and how is it different from the median?
-A percentile is a value that splits the data set such that a certain percentage of observations fall at or below that value. The median is a special case of a percentile, specifically the 50th percentile, which divides the data set into two equal halves.
What are quartiles and why are they important?
-Quartiles are the three most commonly used percentiles, which divide the data set into four equal parts. They are important for identifying the distribution of data and are used to calculate the interquartile range (IQR), which measures the spread of the middle 50% of the data.
How can the interquartile range (IQR) be used to identify outliers in a data set?
-The IQR can be used to identify outliers by calculating the lower and upper fences. Data points that fall below the lower fence (Q1 - 1.5 * IQR) or above the upper fence (Q3 + 1.5 * IQR) are considered outliers.
What is the five number summary and why is it useful?
-The five number summary consists of the minimum, first quartile (Q1), median, third quartile (Q3), and maximum of a data set. It is useful because it provides a comprehensive picture of the data's distribution, center, and spread, and is particularly helpful when dealing with skewed data or data containing outliers.
What is a box plot and how does it visually represent the five number summary?
-A box plot is a graphical representation of the five number summary. It displays the median, quartiles, and the minimum and maximum data values, often with whiskers extending to the minimum and maximum values within the fences, and can indicate outliers with separate markers.
How can the TI-83 or TI-84 calculator be used to analyze a data set as described in the script?
-The TI-83 or TI-84 calculator can be used to store data in lists, calculate the one-variable statistics to obtain the mean, median, standard deviation, and quartiles, draw histograms and modified box plots, and identify outliers within the data set.
Outlines
📊 Introduction to Measures of Position
The instructor begins by introducing the concept of descriptive statistics, specifically focusing on measures of position within a data set. The lesson aims to explain how to use numerical values to describe the position of an observation relative to the rest of the data. The concept of standardizing data points through z-scores is introduced, which involves calculating how many standard deviations an observation is from the mean. The z-score formula is provided for both sample data and population data. The empirical rule is also discussed, which is applicable to symmetric, bell-shaped distributions, and it describes the distribution of data within standard deviations from the mean.
📚 Understanding Z-Scores and Their Applications
This paragraph delves deeper into the use of z-scores, explaining their importance in statistical analysis and inference. Z-scores are particularly useful for comparing data points from different data sets, effectively allowing for the comparison of 'apples and oranges' by standardizing measurements. The instructor provides an example comparing the heights of adult men and women in the U.S., using z-scores to determine who is relatively taller within their respective populations. The paragraph emphasizes the growing relevance of z-scores as the course progresses.
📈 Exploring Percentiles and Quartiles
The instructor introduces percentiles and quartiles as measures of position within a data set. Percentiles divide the data in a way that a specific percentage of observations fall below a certain value. Quartiles are special cases of percentiles, representing the 25th, 50th, and 75th percentiles. An algorithm for finding any percentile is presented, involving sorting the data, calculating the location of the percentile, and determining the actual value based on whether the calculated location is a whole number or not. The paragraph also explains how to find quartiles for a given data set of SAT math scores.
📉 Identifying Outliers Using Quartiles
The concept of outliers in a data set is discussed, along with the resistance of quartiles to the impact of outliers and skewness. The interquartile range (IQR) is introduced as a measure of spread for the middle 50% of the data. The instructor explains how to calculate the IQR and provides a method for identifying outliers using the IQR, known as the IQR test. This involves calculating the lower and upper fences and comparing them to the data points to determine if any are outliers.
📝 Summarizing Data with the Five Number Summary
The five number summary is introduced as a package for summarizing data, which includes the minimum, first quartile (Q1), median, third quartile (Q3), and maximum. This method is particularly useful for data sets with outliers or skewed distributions. The paragraph explains how to use a calculator to obtain these values and describes the box plot as a graphical representation of the five number summary. The instructor also discusses the modified box plot, which is helpful for identifying outliers without performing the IQR test.
📉 Resistance of Summaries to Outliers and Skewness
The instructor discusses the concept of resistance in numerical summaries, highlighting that the median and mode are resistant to the influence of outliers and skewness, while the mean is not. The paragraph emphasizes the importance of choosing the appropriate measures of center and spread based on the characteristics of the data set, such as symmetry and the presence of outliers. The median and interquartile range (IQR) are recommended for skewed distributions or those with outliers, whereas the mean and standard deviation are suitable for symmetric, bell-shaped distributions.
📈 Visualizing Data with Box Plots
The instructor demonstrates how to create a box plot using a calculator, using the SAT math scores as an example. The process involves storing the data, selecting the modified box plot option, and allowing the calculator to draw the plot. The box plot visually represents the five number summary and can indicate outliers. The paragraph also describes what to look for in a box plot to determine if a data set is symmetric, right-skewed, or left-skewed, based on the position of the median within the IQR box and the comparative lengths of the whiskers.
📚 Recap of Descriptive Statistics and Resistance
In the final paragraph, the instructor wraps up the chapter on descriptive statistics by summarizing the key points discussed, including the importance of understanding resistance in numerical summaries. The paragraph emphasizes the differences between the mean, median, and mode in the context of symmetric and skewed distributions. The instructor also highlights the ability to perform various statistical analyses using technology, such as the TI-83 or 84 calculator, which can automate the process of obtaining summaries and visualizing data with box plots and histograms.
Mindmap
Keywords
💡Descriptive Statistics
💡Measures of Position
💡Z-Score
💡Empirical Rule
💡Percentiles and Quartiles
💡Interquartile Range (IQR)
💡Outliers
💡Five Number Summary
💡Box Plot
💡Resistance
Highlights
Introduction to measures of position, emphasizing their importance in statistical analysis and inference.
Explanation of the z-score as a measure of how many standard deviations an observation is from the mean.
Differentiation between sample z-scores and population z-scores, and their respective formulas.
The empirical rule's application to symmetric, bell-shaped distributions and its relation to z-scores.
The utility of z-scores in comparing data points from different datasets, exemplified with heights of adult men and women.
Introduction to percentiles and quartiles as measures of position within a dataset.
The algorithm for identifying any percentile within a dataset, including the calculation of the locator.
The concept of the interquartile range (IQR) as a measure of spread for the middle 50% of observations.
The resistance of quartiles and IQR to the impact of outliers and skewness in a dataset.
Guidance on choosing between mean and standard deviation or median and IQR based on the presence of outliers or skewness.
The definition and identification of outliers using the IQR test, including the calculation of lower and upper fences.
The five-number summary as a package of descriptive statistics suitable for datasets with outliers or skewness.
The box plot as a graphical representation of the five-number summary and its use in identifying outliers.
Instructions on drawing a box plot using a calculator and interpreting its components.
The concept of resistance in numerical summaries and its significance in understanding the impact of outliers and skewness.
The practical application of the TI-83/84 calculator for statistical plots, one-variable stats, and identifying outliers.
Summary of the chapter on descriptive statistics, emphasizing the importance of understanding measures of position and resistance.
Transcripts
Browse More Related Video

Elementary Stats Lesson #3 A
Math 119 Chapter 3 part 3

Statistics 101: Understanding Z-scores
3.3.1 Measures of Relative Standing and Boxplots - Computing and Interpretting z Scores
Math 20 Lesson 3.5 Descriptive Measures for Populations, Z score Video 3

Elementary Statistics - Chapter 6 Normal Probability Distributions Part 1
5.0 / 5 (0 votes)
Thanks for rating: