Find the z-score given the confidence level
TLDRThis instructional video script explains how to calculate z-scores based on a given confidence level using the standard normal distribution. It illustrates the relationship between confidence level (CL) and the normal distribution curve, emphasizing that CL represents the central area under the curve. The script demonstrates how to find the z-scores for a 95% confidence interval, showing the conversion of CL to a decimal and the calculation of alpha, which is split equally into two tails. It guides through using a calculator's inverse norm function to find the corresponding z-scores and highlights the symmetry of the standard normal distribution. The process is also shown for a 90% confidence level, providing a general formula for finding z-scores for any confidence level.
Takeaways
- 📚 The video demonstrates how to find z-scores given a confidence level (CL).
- 📉 The standard normal distribution, denoted by 'z', is used with a mean (mu) of zero and a standard deviation (sigma) of one.
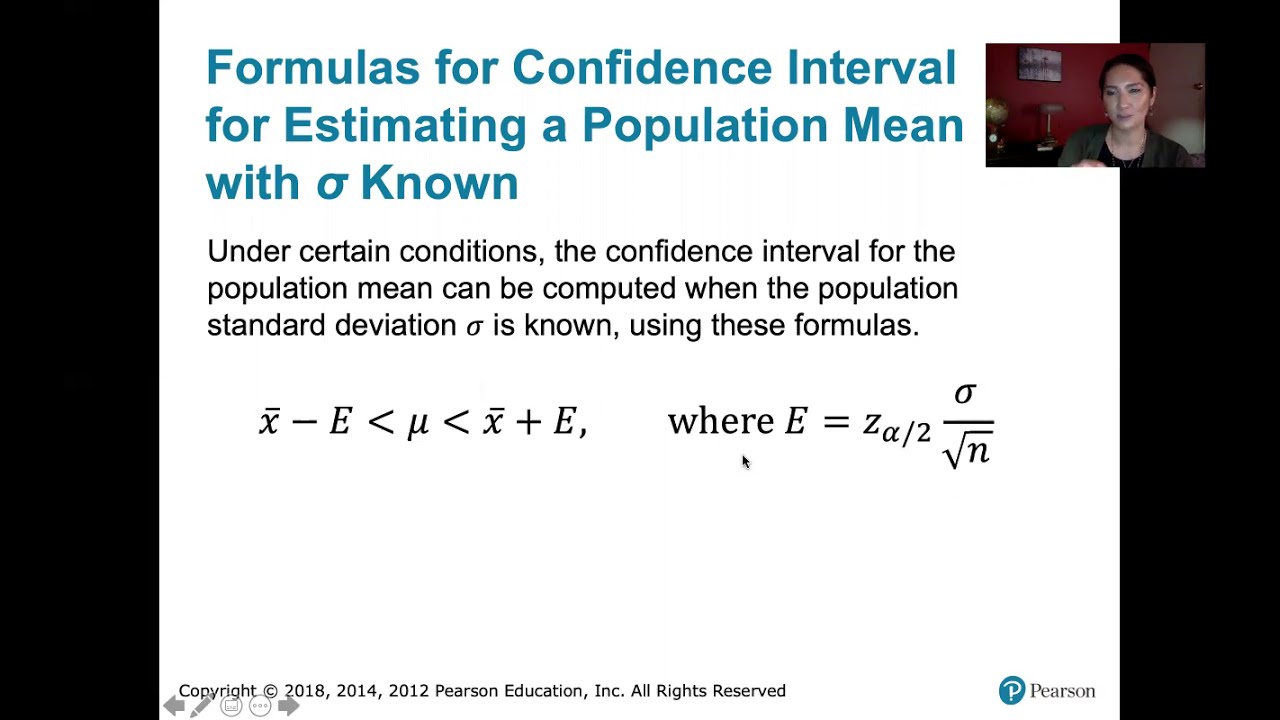
- 🔍 Z-scores are used to create confidence intervals when the population standard deviation is known or when working with population proportions.
- 🔢 The relationship between the confidence level and the normal distribution is that the CL represents the area under the curve in the middle of the distribution.
- 📊 The entire area under the normal distribution curve equals one, and the confidence level plus the alpha (unknown part) equals one.
- 🧩 Alpha is related to the margin of error and is used in hypothesis testing; it can be calculated as one minus the confidence level.
- 🌐 For a 95% confidence level, the area under the curve is 0.95, and alpha is 0.05, which is split equally into two tails, resulting in 0.025 for each.
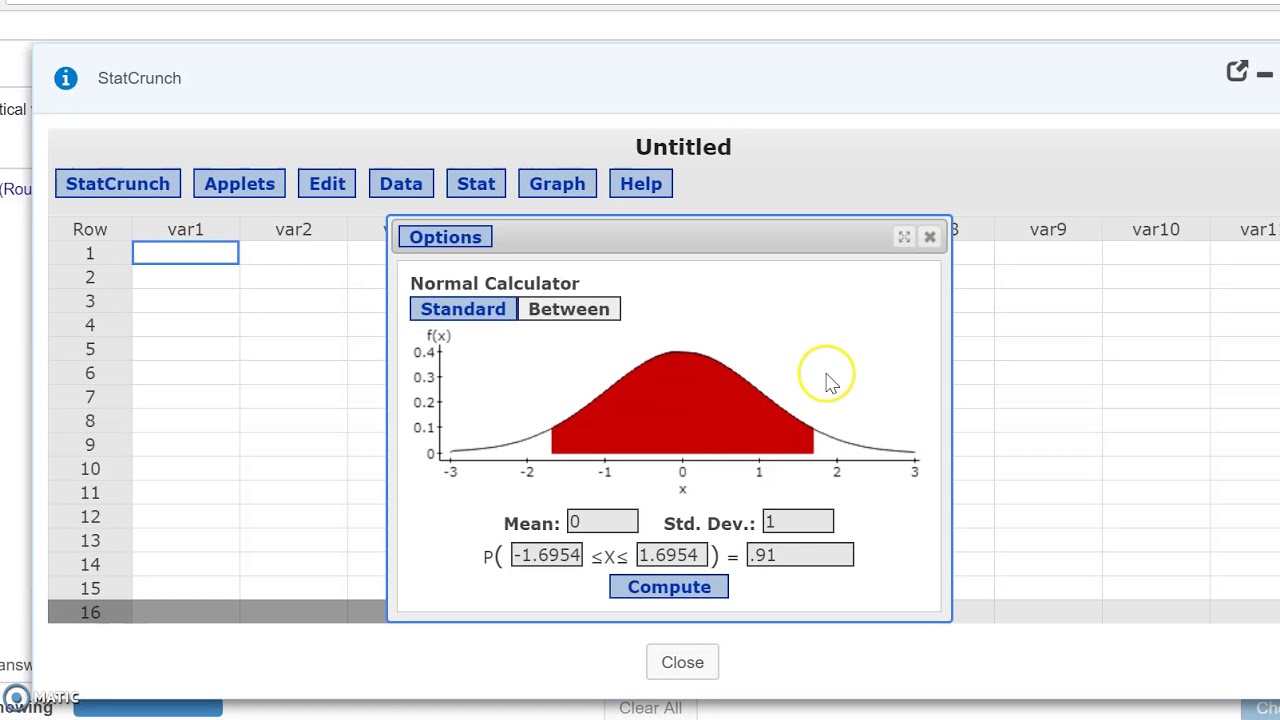
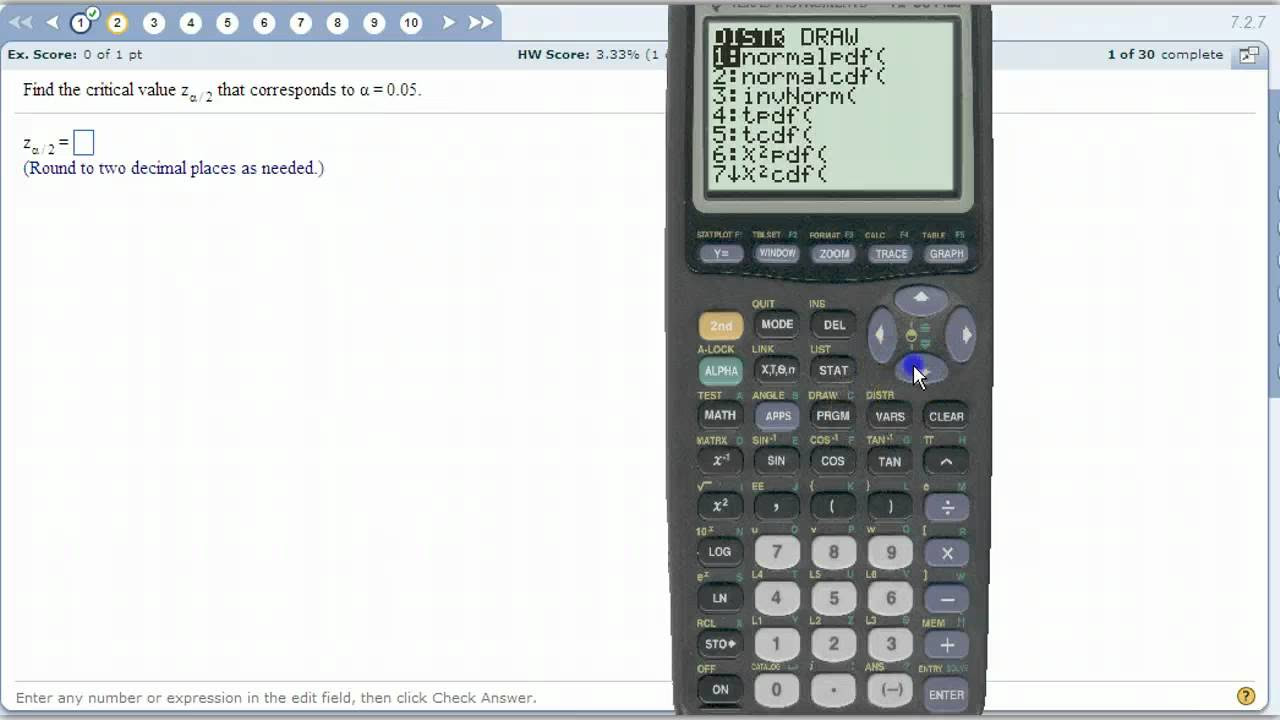
- 🔑 To find the z-score, use the inverse norm function on a calculator, which requires the area to the left of the z-score on the standard normal distribution.
- 📐 The z-score for a 95% confidence level is approximately 1.96, found using the inverse norm of 0.025.
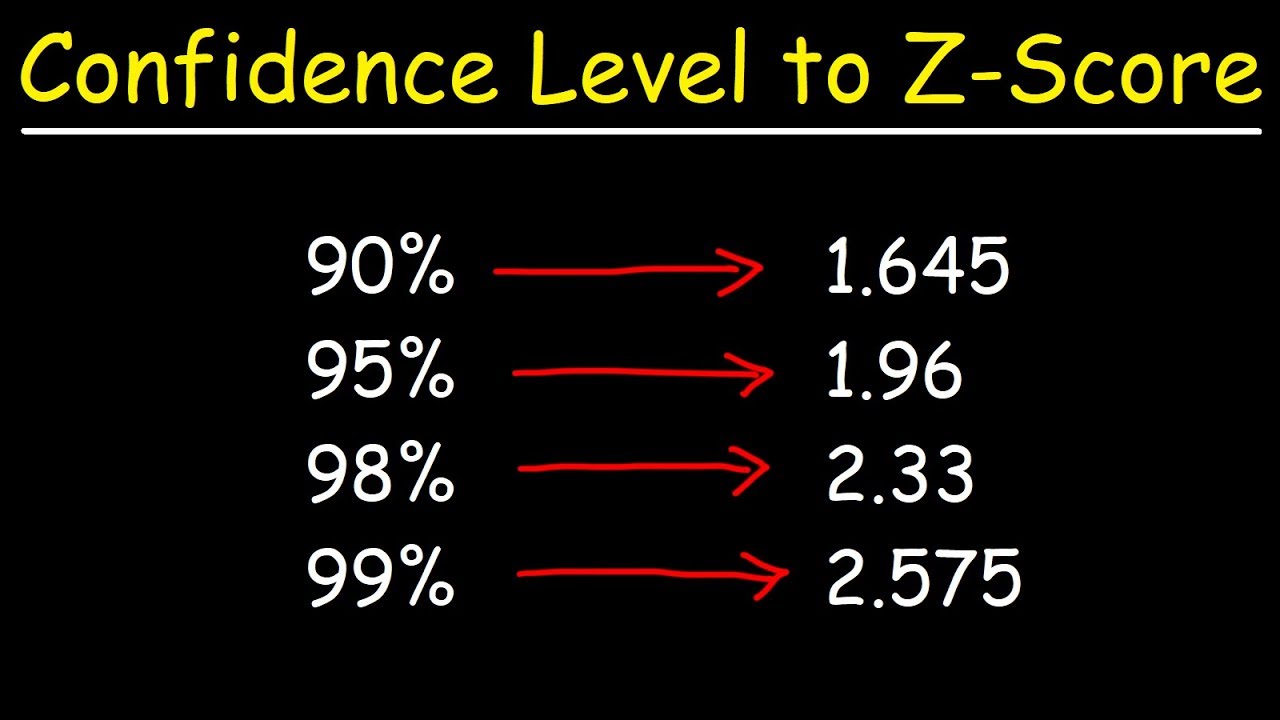
- 📈 Common confidence levels and their corresponding z-scores are provided, such as 90% confidence level with a z-score of 1.645.
- 🔄 The process of finding z-scores for different confidence levels involves calculating alpha, determining the area to the left for each tail, and using the inverse norm function.
Q & A
What is the standard normal distribution?
-The standard normal distribution, represented by 'z', is a normal distribution with a mean (mu) of zero and a standard deviation (sigma) of one.
How is a confidence interval created using the standard normal distribution?
-A confidence interval is created using the standard normal distribution when the population standard deviation is known or when working with population proportions.
What is the relationship between confidence level and the normal distribution?
-The confidence level (CL) is related to the normal distribution by representing the area in the middle of the distribution curve, which is the probability under the curve.
What is alpha in the context of confidence levels and normal distribution?
-Alpha is the unknown part of the distribution outside the confidence level. It is related to the margin of error in hypothesis testing and is calculated as one minus the confidence level.
How do you convert a confidence level to a decimal form for calculations?
-To convert a confidence level to a decimal form, you subtract the percentage from one (e.g., for a 95% confidence level, you use 0.95).
What is meant by 'alpha over two' in the context of the normal distribution?
-'Alpha over two' refers to the division of the alpha value equally between the two tails of the normal distribution curve.
How do you find the z-scores for a given confidence level?
-Z-scores for a given confidence level are found using the inverse norm function on a calculator, which requires the area to the left of the z-score and the standard normal parameters (mean and standard deviation).
What is the z-score for a 95% confidence level?
-The z-score for a 95% confidence level is 1.96, which is found using the inverse norm function with an area to the left of 0.025.
How does symmetry play a role in finding the z-scores for the tails of the normal distribution?
-Symmetry in the normal distribution means that if a z-score is found for one tail, the corresponding z-score for the other tail can be found by simply taking the negative of the first z-score.
What is the z-score for a 90% confidence level?
-The z-score for a 90% confidence level is 1.645, which is calculated using the inverse norm function with an area to the left of 0.05 (after accounting for the 90% in the middle).
What is the notation used to represent the z-score for a specific confidence level?
-The notation used to represent the z-score for a specific confidence level is 'z alpha over two', where alpha over two is the area in each tail of the distribution.
Outlines
📊 Understanding Z-Scores and Confidence Levels
The instructor begins by explaining the concept of z-scores in the context of confidence levels, denoted as CL. The standard normal distribution, characterized by a mean (mu) of zero and a standard deviation (sigma) of one, is introduced as the basis for calculating z-scores. The relationship between confidence levels and the normal distribution is illustrated, with the confidence level represented as the central area under the curve. The instructor clarifies that the total area under the curve equals one, and the unknown areas outside the confidence level are referred to as alpha. The significance of alpha in hypothesis testing is briefly mentioned. A step-by-step example is provided for a 95% confidence level, demonstrating the conversion of this percentage into a decimal (0.95) and the subsequent calculation of alpha (0.05). The process of finding the z-scores using an inverse norm calculator is detailed, with specific instructions on how to input values and obtain the z-scores for the given confidence level.
🔍 Calculating Z-Scores for Different Confidence Levels
Building upon the foundation laid in the previous paragraph, the instructor continues to explain how to calculate z-scores for various confidence levels. The process involves determining the alpha value, which is then split equally into two tails of the normal distribution curve. The example of a 95% confidence level is revisited, with the calculation of alpha resulting in 0.05, which is then divided by two to find the z-scores for both tails. Using a calculator's inverse norm function, the instructor demonstrates how to input the area to the left of the z-score to find its value. The symmetry of the standard normal distribution is highlighted, with the positive and negative z-scores being equal in magnitude but opposite in sign. The z-scores for a 95% confidence level are found to be -1.96 and 1.96, with the positive value typically used in constructing confidence intervals. The concept of z-alpha over two is introduced as a notation to represent the z-score for a specific confidence level, with z0.025 being equal to 1.96 for a 95% confidence level. Common confidence levels and their corresponding z-scores are also discussed, providing a general formula for students to apply to different scenarios.
📐 Demonstrating Z-Score Calculation for a 90% Confidence Level
The instructor concludes the lesson by demonstrating the calculation of the z-score for a 90% confidence level. The process mirrors the previous examples, starting with the conversion of the confidence level percentage into a decimal (0.9) and calculating the alpha value (0.1). The alpha is then split into two tails, each representing 0.05. The inverse norm function on a calculator is used to find the z-score corresponding to the area to the left of 0.95 on the standard normal distribution curve. The calculated z-score for a 90% confidence level is confirmed to be 1.645, which matches the table value provided. The instructor also emphasizes the symmetry of the normal distribution, noting that the negative z-score counterpart would be -1.645. Multiple methods for finding z-scores are mentioned, reinforcing the use of the inverse norm function as a reliable approach. The lesson ends with a reminder of the importance of understanding the concepts and steps involved in calculating z-scores for different confidence levels.
Mindmap
Keywords
💡z-scores
💡confidence level (CL)
💡standard normal distribution
💡alpha (α)
💡confidence interval
💡inverse norm
💡hypothesis testing
💡population standard deviation
💡population proportion
💡calculator
💡symmetry
Highlights
Introduction to finding z-scores from a given confidence level.
Explanation of confidence level (CL) and its relation to the standard normal distribution.
Description of the standard normal distribution with mean (mu) of zero and standard deviation (sigma) of one.
Use of z-scores in creating confidence intervals for population proportions or means.
Illustration of how confidence level relates to the area under the normal distribution curve.
Concept of alpha (α) as the unknown part of the distribution outside the confidence level.
Formula rearrangement to find the confidence level as one minus alpha (1 - α).
Example of calculating a 95% confidence level and converting it to a decimal form.
Determination of alpha value for a 95% confidence level as 0.05 split into two tails.
Use of inverse norm in a calculator to find the z-scores corresponding to the area.
Process of finding z-scores for a 95% confidence level using the calculator.
Calculation of the z-score for a 95% confidence level as 1.96.
Explanation of symmetry in the standard normal distribution and its impact on z-scores.
Demonstration of finding z-scores for a 90% confidence level.
Conversion of the 90% confidence level to a decimal and finding the corresponding alpha.
Use of inverse norm to calculate the z-score for a 90% confidence level as 1.645.
Confirmation of the calculated z-score with a table value and its representation.
Discussion on the symmetry of the standard normal distribution and its implications for z-scores.
Conclusion and summary of the process for finding z-scores from confidence levels.
Transcripts
Browse More Related Video
How To Find The Z Score Given The Confidence Level of a Normal Distribution 2
Find Critical Value Za/2 with Statcrunch
7.2.5 Estimating a Population Mean - Confidence Intervals with Known Pop. Standard Deviation

Z-Scores, Standardization, and the Standard Normal Distribution (5.3)
Critical values for Confidence Intervals
How to find critical Z value (Z alpha)
5.0 / 5 (0 votes)
Thanks for rating: