6.1.4 The Standard Normal Distribution - Given a range of z scores, find areas or probabilities.
TLDRThis video tutorial focuses on calculating areas and probabilities associated with z-scores in a standard normal distribution, essential for understanding continuous probability distributions. It introduces two primary methods: using technology like Excel for precision or the traditional Table A2 for exam situations. The script guides viewers on how to interpret z-scores, find areas to the left or right of a z-score, and between two z-scores, emphasizing the importance of accuracy and understanding the relationship between areas under the curve and probabilities.
Takeaways
- 📚 The video discusses learning outcome number four from lesson 6.2, focusing on finding areas or probabilities corresponding to a range of z-scores in a standard normal distribution.
- 📉 Continuous probability distributions are characterized by probabilities that correspond to areas under the curve, with the total area under the curve always equaling 1.
- 📊 The standard normal distribution is a special case with a mean of 0 and a standard deviation of 1, and areas or probabilities can be found using technology or Table A2.
- 🛠️ Technology, such as Excel, is recommended for its accuracy and precision, but Table A2 is also important for exam situations where technology may not be available.
- 🔢 Table A2 is designed for the standard normal distribution and has separate pages for negative and positive z-scores, indicating areas to the left of each z-score.
- ⚠️ It's crucial to distinguish between z-scores (which are on the outside of Table A2) and areas or probabilities (which are found inside the table) to avoid confusion.
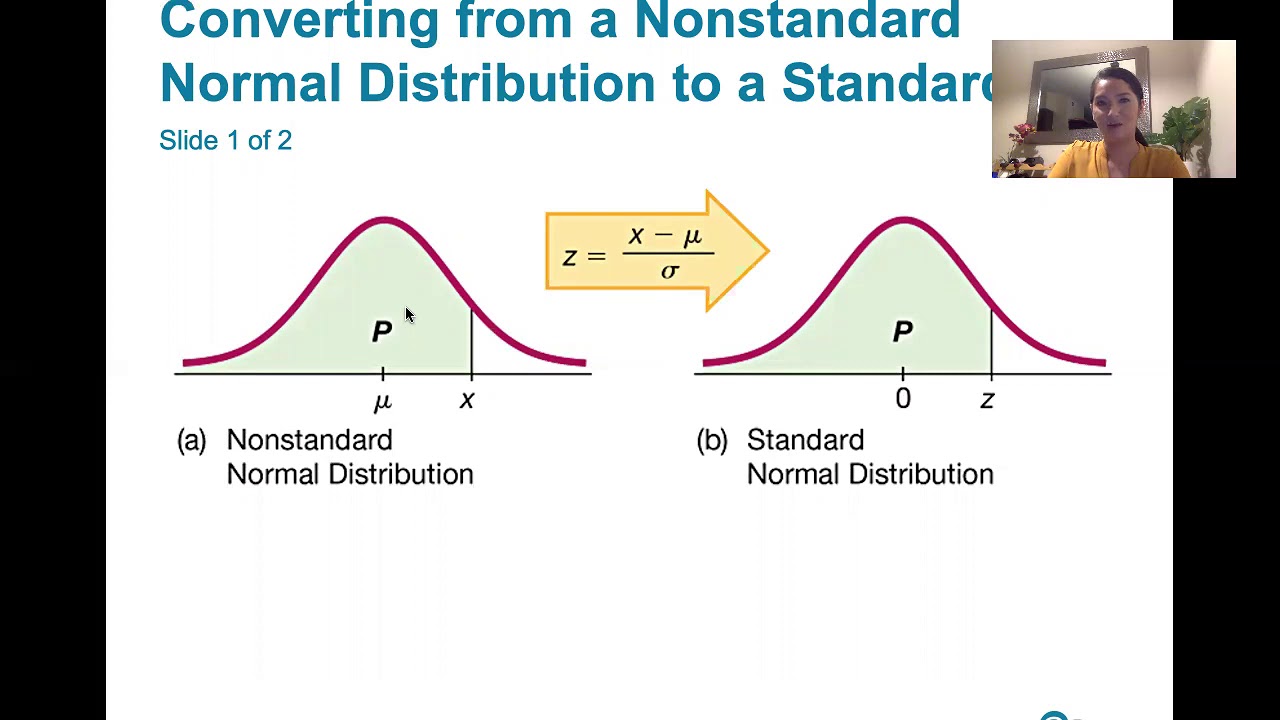
- 🔍 For non-standard normal distributions, conversion formulas can be used to standardize them before utilizing Table A2 for probability calculations.
- 📈 Excel's NORM.DIST function can be used to find the cumulative area to the left of a z-score in a standard normal distribution, providing a more precise result.
- 📝 The video provides an example using bone density test scores, illustrating how to find the probability of a test result being within a certain range using both Table A2 and Excel.
- 🔄 To find the area to the right of a z-score or between two z-scores, one must use the complement rule, subtracting the area to the left from 1.
- 📚 The lesson emphasizes the importance of understanding the concept of areas corresponding to probabilities in continuous distributions rather than just memorizing formulas.
Q & A
What is the main topic discussed in this video script?
-The main topic discussed in this video script is finding areas or probabilities corresponding to a range of z-scores in the context of the standard normal distribution.
Why is the total area under the curve of a continuous probability distribution always equal to 1?
-The total area under the curve of a continuous probability distribution is always equal to 1 because it represents the entire probability space for all possible outcomes of the random variable.
What are the two methods mentioned in the script for finding probabilities associated with normally distributed variables?
-The two methods mentioned for finding probabilities associated with normally distributed variables are using technology, such as Excel, and using Table A2, a standard normal distribution table.
What is the standard normal distribution and why is it special?
-The standard normal distribution is a normal distribution with a mean of 0 and a standard deviation of 1. It is special because it serves as a basis for converting any normal distribution to a standard form, allowing for easier probability calculations.
How can non-standard normal distributions be converted to a standard normal distribution?
-Non-standard normal distributions can be converted to a standard normal distribution by using certain formulas that involve the original mean and standard deviation of the distribution, which are discussed in lesson 6.2.
What does Table A2 describe and what is its purpose?
-Table A2 describes the standard normal distribution and is used to find the area to the left of a given z-score, which corresponds to the probability of the random variable falling within a certain range in a standard normal distribution.
Why is it important to distinguish between areas and z-scores when using Table A2 or similar tools?
-It is important to distinguish between areas and z-scores to avoid confusion and ensure accurate probability calculations. Z-scores are on the outside of the table and represent the number of standard deviations from the mean, while areas and probabilities are on the inside, representing the likelihood of the z-score occurring.
How can Excel be used to find the probability that a z-score is less than a certain value?
-Excel can be used to find the probability that a z-score is less than a certain value by using the NORM.DIST function, which calculates the cumulative area to the left of a specified z-score in a standard normal distribution.
What is the meaning of the area to the right of a z-score in a probability context?
-The area to the right of a z-score represents the probability that the random variable is greater than the value corresponding to that z-score. It can be found by subtracting the area to the left of the z-score from 1.
How can the probability that a z-score lies between two values be calculated?
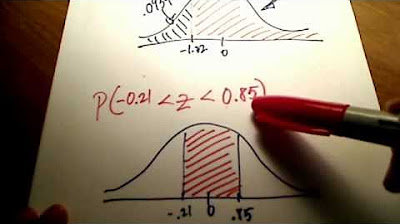
-The probability that a z-score lies between two values can be calculated by finding the area to the left of the larger z-score and subtracting the area to the left of the smaller z-score, which gives the area between the two z-scores.
What is the significance of the mean and standard deviation in the context of the standard normal distribution?
-In the context of the standard normal distribution, the mean is the central value around which all other values are measured and is set to 0. The standard deviation, also set to 1, indicates the dispersion of the values around the mean. Both are essential in defining the shape and characteristics of the distribution.
Outlines
📚 Introduction to Z-Score Probabilities
This paragraph introduces the concept of finding areas or probabilities associated with z-scores in the context of continuous probability distributions, specifically the standard normal distribution. It emphasizes that the total area under the curve of a probability density function is 1, and that areas to the left of a z-score represent probabilities. The paragraph also mentions two methods for finding these probabilities: using technology like Excel or a z-table (table A2), with a preference for technology due to its accuracy. The author explains that table A2 is important for exams and should be understood for non-standard normal distributions, which can be converted to standard form using specific formulas.
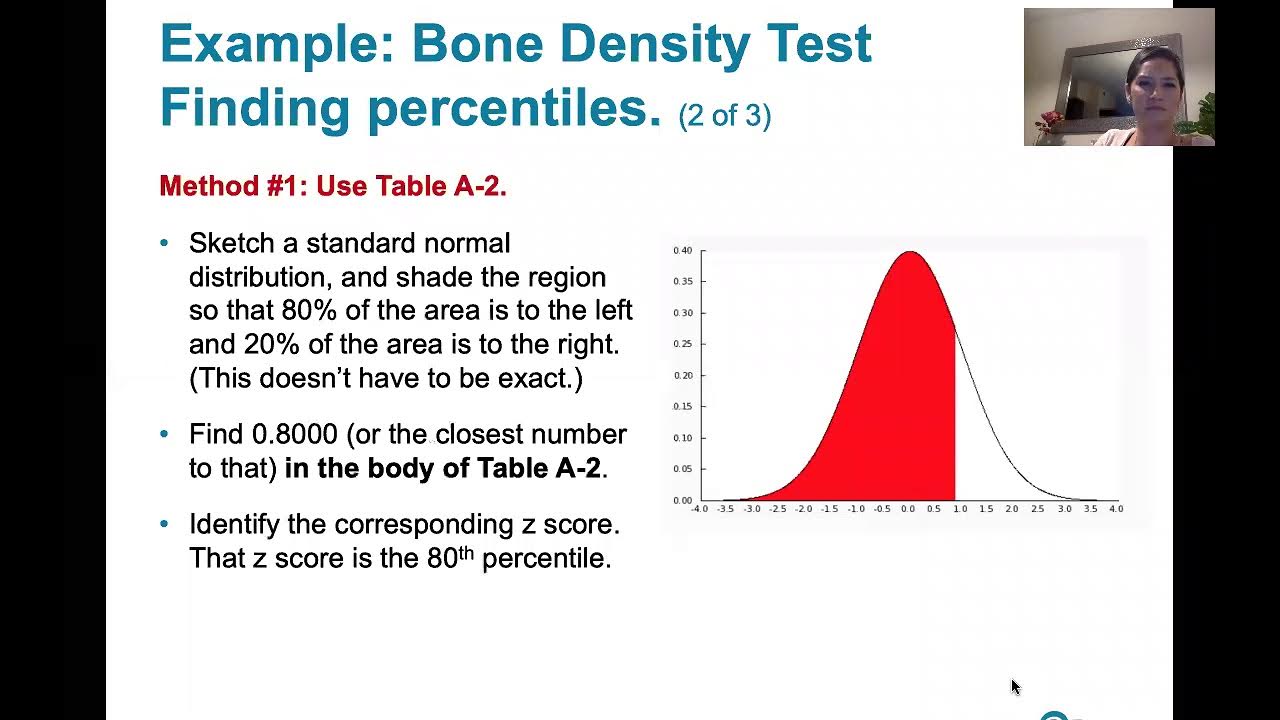
📘 Understanding Z-Tables and Probabilities
The second paragraph delves into the specifics of using table A2 to find probabilities associated with z-scores. It clarifies that table A2 is designed for the standard normal distribution and explains the layout of the table, which includes separate pages for negative and positive z-scores. The paragraph describes how the body of the table represents the area to the left of a given z-score and how to infer the area to the right or between two z-scores. It also discusses the importance of not confusing z-scores with areas and the process of looking up z-scores on the outside of the table and finding the corresponding areas on the inside.
🔍 Case Study: Bone Density Test and Z-Scores
This paragraph presents a practical example involving bone density tests, which are measured as z-scores following a standard normal distribution. The example illustrates how to find the probability that a randomly selected adult's bone density test score is less than 1.27. The explanation includes a step-by-step guide on using both table A2 and Excel to determine the area to the left of the z-score, which corresponds to the desired probability. The paragraph also introduces the notation for probabilities and areas associated with z-scores and emphasizes the importance of understanding the problem's requirements.
📊 Excel Calculation of Z-Score Probabilities
The fourth paragraph demonstrates how to use Excel to calculate the probability associated with a z-score, continuing the example of the bone density test. It explains the use of the NORM.DIST function in Excel, which requires the z-score, the mean, the standard deviation, and a boolean value indicating whether the area to the left of the z-score is desired. The paragraph shows the process of entering these values into Excel and obtaining the probability that a bone density test score is less than 1.27, highlighting the increased accuracy of technology over tables.
📉 Finding Probabilities for Z-Scores Above a Certain Value
This paragraph addresses how to find the probability that a z-score is greater than a specific value, using the example of a bone density test score being above negative 1.0. It explains that since tables only provide the area to the left of a z-score, the area to the right can be found by subtracting the area to the left from 1. The paragraph guides through the process of looking up the area to the left of negative 1.0 in table A2 and then calculating the area to the right, which represents the probability of a normal bone density test result.
📈 Using Excel to Determine Areas to the Right of Z-Scores
The sixth paragraph shows how to use Excel to find the area to the right of a z-score, again referring to the bone density test example. It describes the process of using the NORM.DIST function in Excel to find the area to the left of negative 1.0 and then subtracting this value from 1 to obtain the area to the right. The paragraph reinforces the concept that the total area under the curve is 1 and that the area to the right is the complement of the area to the left.
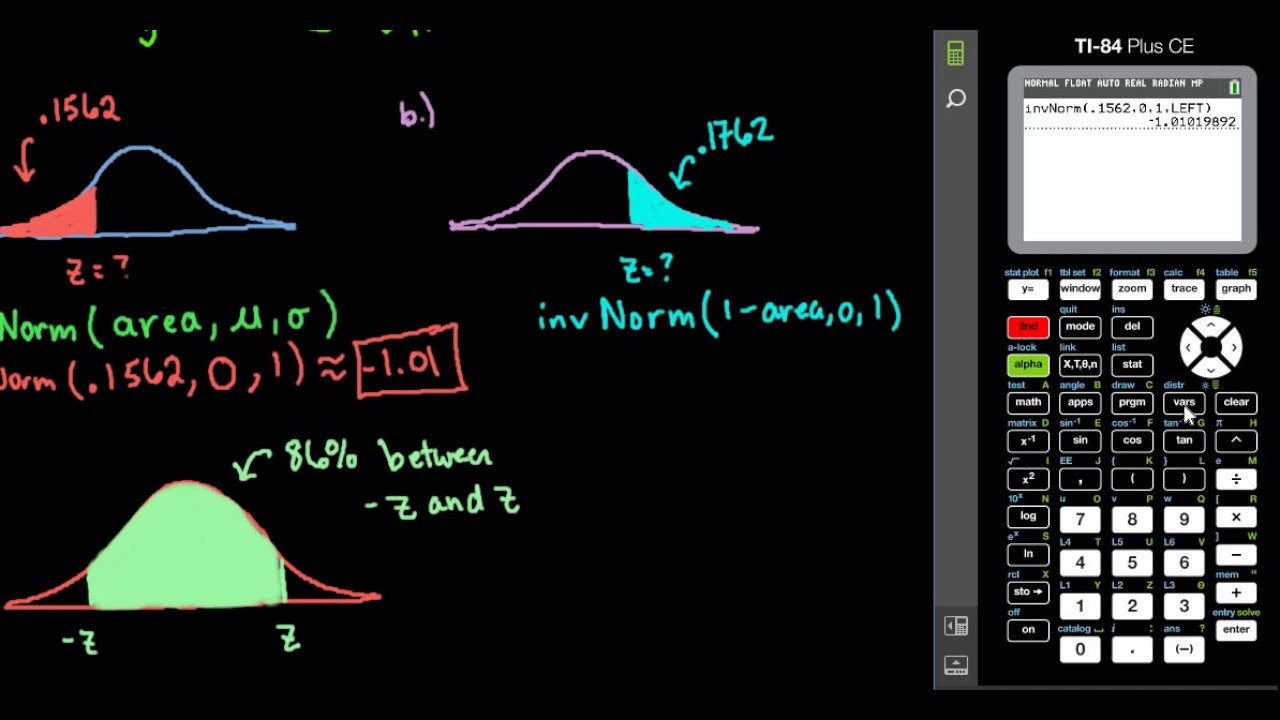
📝 Calculating the Probability Between Two Z-Scores
The seventh paragraph discusses the calculation of the probability that a z-score falls between two values, using the example of determining the likelihood of a person having a bone density test score indicating osteopenia, which is between negative 1 and negative 2.5. It explains the process of finding the area to the left of the larger z-score and then subtracting the area to the left of the smaller z-score to find the area between them. The paragraph also shows how to perform this calculation using Excel and emphasizes the importance of understanding the concept visually rather than memorizing a formula.
🔚 Conclusion: Summary of Finding Areas and Probabilities for Z-Scores
The final paragraph wraps up the discussion by summarizing the process of finding areas and probabilities associated with z-scores in the context of continuous probability distributions. It reiterates the importance of understanding that areas under the curve correspond to probabilities and that the total area under the curve is always 1. The paragraph also mentions that the next video will cover how to find z-scores given known areas or probabilities, indicating a continuation of the topic in subsequent educational content.
Mindmap
Keywords
💡Continuous Probability Distributions
💡Standard Normal Distribution
💡Z-Score
💡Area Under the Curve
💡Probability Density Function (PDF)
💡Table A2
💡Technology (Excel, Statdisk, Minitab, Statcrunch)
💡Cumulative Area
💡Complement of an Area
💡Bone Density Test
Highlights
The video discusses how to find areas or probabilities corresponding to a range of z-scores in a standard normal distribution.
Total area under the curve of a continuous probability distribution is always equal to 1.
The standard normal distribution has a mean of 0 and a standard deviation of 1.
Two methods for finding probabilities: using technology like Excel or a Z-table (Table A2).
Excel provides more accuracy with additional decimal places compared to Table A2.
Table A2 is essential for exams and should be used for practice.
Z-scores represent the number of standard deviations above or below the mean.
Table A2 has separate pages for negative and positive z-scores.
The body of Table A2 shows the area to the left of the z-score.
To find the area to the right of a z-score, subtract the area to the left from 1.
Excel's NORM.DIST function can calculate the cumulative area to the left of a z-score.
The video provides an example of finding the probability of a bone density test score being less than 1.27.
The area to the left of a z-score in Table A2 corresponds to the probability of that z-score.
The video demonstrates how to find the area between two z-scores using both Table A2 and Excel.
Understanding the concept of areas between z-scores is more insightful than memorizing formulas.
The video concludes by emphasizing the importance of areas corresponding to probabilities in continuous distributions.
Transcripts
Browse More Related Video
6.1.5 Standard Normal Distribution - z scores Corresponding to Areas. Percentiles. Critical Values.
6.2.1 Nonstandard Normal Distributions -Converting B/t Standard and Nonstandard Normal Distributions

Elementary Stats Lesson #11
6.1.0 The Standard Normal Distribution - Lesson Overview, Learning Outcomes
Stats: Finding Probability Using a Normal Distribution Table
Finding Z-score Given Area - TI-84
5.0 / 5 (0 votes)
Thanks for rating: