How to Read an ECG | ECG Interpretation | EKG | OSCE Guide | UKMLA | CPSA
TLDRIn this informative video, Olivia from Geeky Medics offers a comprehensive guide to interpreting Electrocardiograms (ECGs). She explains the basics of ECGs, including the significance of P waves, QRS complexes, ST segments, and T waves in representing the heart's electrical activity. The video outlines a structured approach to ECG interpretation, emphasizing the importance of checking patient details, understanding the clinical context, and examining the heart rate and rhythm. It also covers irregular rhythms, cardiac axis, P wave analysis, PR interval, and various types of AV blocks. The guide delves into the assessment of QRS complexes, bundle branch blocks, ST segment abnormalities, and the significance of T waves and U waves. A case study is presented to test viewers' interpretation skills, highlighting the identification of atrial fibrillation through the absence of P waves and an irregularly irregular rhythm. The video concludes with advice on documenting ECG interpretations and further resources for practice.
Takeaways
- 📊 **ECG Basics**: An ECG records the heart's electrical activity from different angles to identify and locate pathology.
- 🔌 **Electrode Placement**: ECGs are recorded by placing electrodes on the patient, which are conductive pads that capture heart electrical activity.
- 📈 **ECG Lead Structure**: A 12-lead ECG produces 12 separate graphs, but only 10 physical electrodes are attached to the patient.
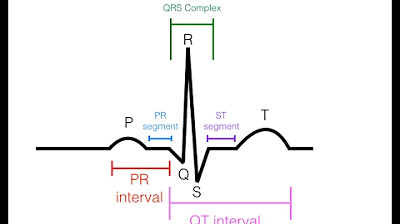
- 🌉 **ECG Wave Components**: The ECG cycle includes P waves (atrial contraction), PR interval, QRS complex (ventricular contraction), ST segment, and T wave (ventricular repolarization).
- ⏱️ **Heart Rate Calculation**: Heart rate is calculated by counting QRS complexes and can be done using the RR interval for regular rhythms or a 10-second rhythm strip for irregular rhythms.
- 📏 **Cardiac Axis**: The cardiac axis represents the direction of electrical activity through the heart and is normally between -30° and +90°.
- 🔍 **Rhythm Assessment**: Regular or irregular rhythms can be identified by marking out consecutive RR intervals and checking for patterns.
- 🌀 **P Wave Analysis**: P waves represent atrial depolarization, and their presence, normality, or absence is critical in ECG interpretation.
- 🕰️ **PR Interval**: A normal PR interval is between 120 and 200 milliseconds, with prolongation suggesting atrioventricular delay or block.
- 🏔️ **QRS Complex**: The QRS complex's width, height, and morphology are assessed for signs of ventricular hypertrophy or conduction abnormalities.
- 📉 **ST Segment**: ST segment elevation or depression can indicate acute coronary syndromes or myocardial ischemia.
- 📶 **T Waves and U Waves**: T waves represent ventricular repolarization, and U waves, when present, can be associated with electrolyte imbalances or certain medications.
Q & A
What does an ECG record?
-An ECG records the electrical activity of the heart from different angles to identify and locate pathology.
How many separate graphs does a 12 lead ECG produce?
-A 12 lead ECG produces 12 separate graphs on a piece of ECG paper.
What do P waves on an ECG represent?
-P waves represent atrial depolarization or contraction in healthy individuals.
What does the PR interval represent?
-The PR interval represents the time for electrical activity to move between the atria and the ventricles.
What is the normal duration of the PR interval?
-The PR interval should be between 120 and 200 milliseconds.
What does the QRS complex represent?
-The QRS complex represents the depolarization or contraction of the ventricles.
What is the normal range for a patient's heart rate?
-A normal heart rate is between 60 to 100 beats per minute.
What is the cardiac axis and what is its normal range?
-The cardiac axis represents the overall direction of electrical activity as it spreads through the cardiac conduction system. In healthy individuals, the cardiac axis should lie between -30° and +90°.
What is the difference between a regular and irregular heart rhythm?
-A regular heart rhythm has consistent intervals between beats, while an irregular rhythm has variable intervals, which can be either regularly irregular (a recurrent pattern of irregularity) or irregularly irregular (completely disorganized).
What is the significance of a Delta wave on an ECG?
-A Delta wave, which is a slurred upstroke of the QRS complex, is associated with accessory pathways that bypass the AV node and stimulate the ventricles prematurely, a condition known as preexcitation, often seen in Wolf-Parkinson-White syndrome.
What are the characteristics of a normal QRS complex?
-A normal QRS complex should be less than 0.12 seconds or three small squares in width, with a height that is not too small or tall, and without any abnormal morphology.
What does the presence of U waves on an ECG indicate?
-U waves, when present, are a greater than 0.5 mm deflection seen after the T-wave and are often associated with electrolyte imbalances, hypothermia, or the use of certain antiarrhythmic therapies.
Outlines
😀 Introduction to ECG Interpretation
Olivia from Geeky Medics introduces the topic of ECG interpretation. She emphasizes the importance of checking the ECG for patient details, date, time, and calibration. The basics of an ECG are explained, including the different waves (P wave, PR interval, QRS complex, ST segment, T wave, and QT interval) and their significance in reflecting the heart's electrical activity. The video promises a structured approach to ECG interpretation and a case study to test viewers' skills.
🔍 Calculating Heart Rate and Identifying Rhythms
The video explains two methods for calculating heart rate: using the RR interval for regular rhythms and counting QRS complexes for irregular rhythms. It also discusses how to determine if a heart rhythm is regular or irregular, with examples of atrial fibrillation and atrioventricular blocks. The concept of cardiac axis is introduced, detailing its normal range and how deviations can indicate certain health conditions like right or left ventricular hypertrophy.
📊 ECG Features: P Waves, PR Interval, and AV Blocks
The video delves into the specifics of P waves, PR intervals, and different types of atrioventricular (AV) blocks. It describes how to assess P wave presence and morphology and the implications of their absence. The PR interval's normal range and what a prolonged PR interval might suggest are also covered. The video outlines first-degree, second-degree type 1 (Wenckebach phenomenon), second-degree type 2, and third-degree (complete) AV block characteristics and their clinical significance.
🏥 Advanced ECG Interpretation: QRS Complexes and Bundle Branch Blocks
The video discusses in detail the QRS complex, which signifies ventricular depolarization. It covers the width, height, and morphology of the QRS complex, including the identification of Delta waves and broad QRS complexes associated with conditions like ventricular ectopics and bundle branch blocks. The characteristics of right and left bundle branch blocks are explained using the William Marrow pneumonic. The implications of a shortened PR interval and the presence of a Delta wave in the context of Wolf-Parkinson-White syndrome are also addressed.
📈 ST Segment, T Waves, U Waves, and ECG Interpretation Documentation
The video explains the significance of the ST segment, T waves, and U waves in an ECG. It describes how abnormalities in these areas can indicate conditions like myocardial infarction or ischemia. The importance of knowing which ECG leads represent specific heart regions for localizing pathology is highlighted. The video concludes with a case study demonstrating how to apply the structured approach to ECG interpretation. It also advises on documenting the interpretation, including patient details, ECG performance time, and the interpreter's findings and plan.
📚 Further Resources and Practice
The video concludes with an invitation to practice ECG interpretation skills using Geeky Medics' online resources and to consult their textbook for a comprehensive guide to clinical examination skills. The video ends with a reminder to visit the Geeky Medics website for more information and resources.
Mindmap
Keywords
💡ECG
💡P waves
💡QRS complex
💡ST segment
💡T wave
💡QT interval
💡Heart rate
💡Cardiac axis
💡Atrial fibrillation
💡Bundle branch block
💡AV block
Highlights
ECG records the heart's electrical activity from different angles to identify and locate pathology.
ECGs are recorded by placing electrodes on the patient, which create a graphical representation known as ECG leads.
A 12-lead ECG produces 12 separate graphs, but only requires 10 physical electrodes.
P waves represent atrial depolarization, and should precede each QRS complex in healthy individuals.
The PR interval represents the time for electrical activity to move between the atria and ventricles.
QRS complex signifies the depolarization or contraction of the ventricles.
The ST segment is an isoelectric line representing the time between ventricular depolarization and repolarization.
T-wave represents ventricular repolarization, appearing as a small upward deflection after the QRS complex.
QT interval represents the time taken for the ventricles to depolarize and repolarize.
When interpreting an ECG, confirm the patient's identity, the ECG's date and time, and understand the clinical context.
Heart rate calculation methods vary depending on whether the rhythm is regular or irregular.
Regularly irregular rhythms have a recurrent pattern of irregularity, while irregularly irregular rhythms are disorganized.
Cardiac axis represents the overall direction of electrical activity through the heart and should lie between -30° and +90°.
Right axis deviation indicates a distortion to the right, often caused by right ventricular hypertrophy.
Left axis deviation suggests a distortion to the left, usually caused by left ventricular hypertrophy or conduction abnormalities.
P wave assessment involves checking for presence, normality, and any atrial activity in the absence of visible p waves.
PR interval should be between 120 and 200 milliseconds, with prolongation suggesting atrioventricular delay or block.
Wolff-Parkinson-White (WPW) syndrome is associated with an accessory pathway that causes preexcitation of the ventricles.
Bundle branch block results in broad QRS complexes due to abnormal depolarization sequence.
ST segment elevation or depression can indicate acute coronary syndromes or myocardial ischemia.
T-wave inversion can be a sign of underlying pathology, such as myocardial ischemia or myocarditis.
U waves, when present, are seen after the T-wave and can indicate electrolyte imbalances or certain medications' effects.
Documenting ECG interpretation includes patient details, ECG performance date and time, interpretation, and overall impression and plan.
Transcripts
Browse More Related Video

MASTER ECG/EKG INTERPRETATION: A Systematic Approach for 12 Lead ECG/EKGs | Retired

EKG Basics | How to Read & Interpret EKGs: Updated Lecture
EKG/ECG Interpretation (Basic) : Easy and Simple!

Cardiovascular | EKG Basics

How To Read An ECG

EKG Rhythms | ECG Heart Rhythms Explained - Comprehensive NCLEX Review
5.0 / 5 (0 votes)
Thanks for rating: