Graphing Trigonometric Functions, Phase Shift, Period, Transformations, Tangent, Cosecant, Cosine
TLDRThis video tutorial delves into the intricacies of graphing trigonometric functions, focusing on sine, cosine, secant, cosecant, tangent, and cotangent. It explains how to identify key characteristics such as amplitude, period, and vertical shifts, and provides a step-by-step guide for plotting these functions. The video also addresses the domain and range of each function, offering examples to illustrate how to calculate periods and phase shifts. By the end, viewers will have a solid understanding of how to graph a variety of trigonometric functions and their transformations.
Takeaways
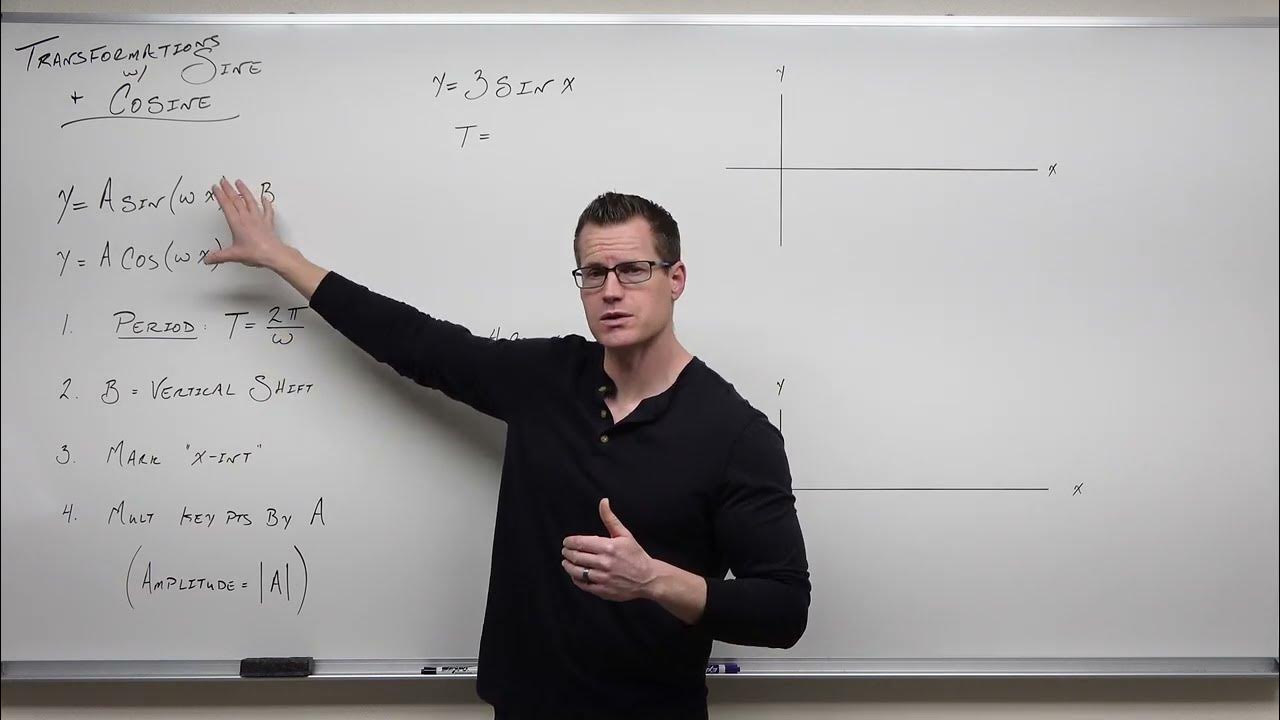
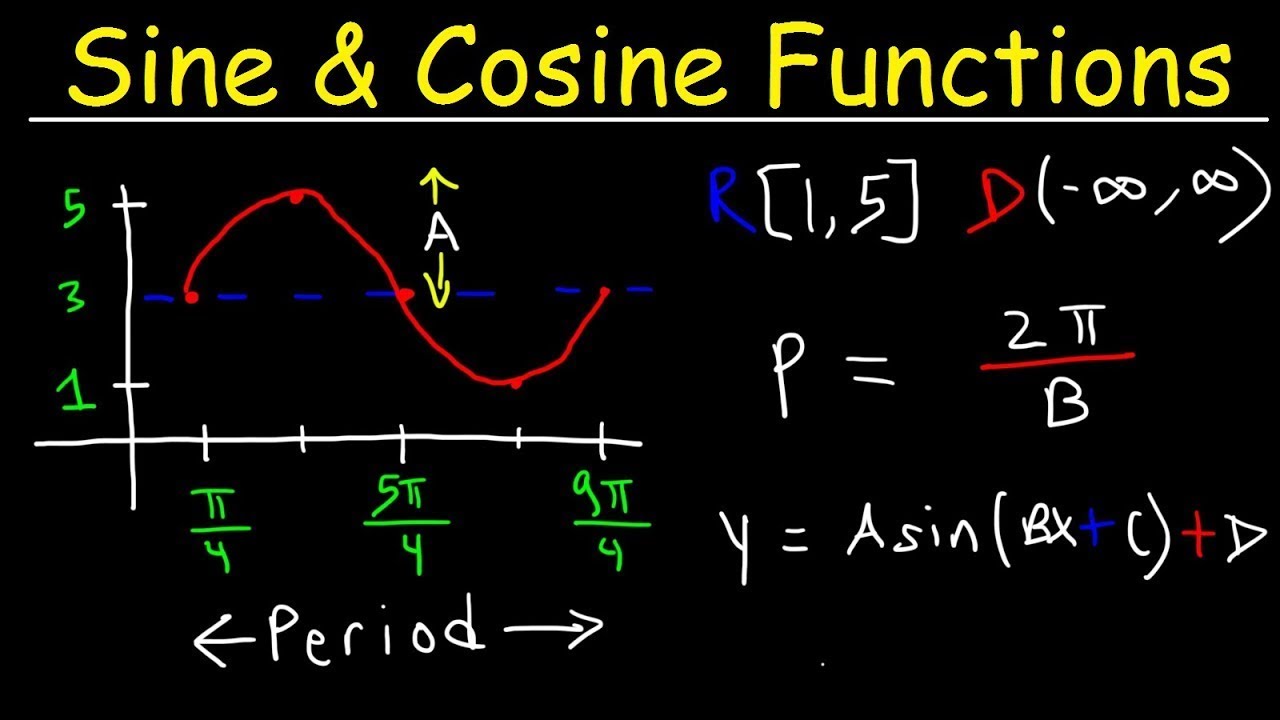
- 📈 The general form of a sine wave is y = A sin(Bx + C) + D, where A represents amplitude, B is related to the period, C is the phase shift, and D is the vertical shift.
- 📊 To graph sine and cosine functions, identify the amplitude, period, phase shift, and vertical shifts. Sine starts at the center and oscillates between peaks, while cosine starts at the peak and oscillates similarly.
- 🔄 The period of a sine or cosine function is calculated as 2π/B, where B is the coefficient of x. The period represents the length of one complete cycle of the function.
- 🔽 Vertical shifts are represented by the value of D in the equation. A positive D shifts the graph up, while a negative D shifts it down.
- 🔄 Phase shifts are represented by the value of C in the equation. To find the phase shift, set x + C = 0 and solve for x, which gives the horizontal shift.
- 📈 The amplitude of a function affects the range of the graph. It determines the maximum and minimum values the function可以达到. For example, y = A sin(x) has a range of [-A, A] when A is positive.
- 📌 For tangent and cotangent functions, the period is π/B, and they have vertical asymptotes at odd multiples of π/2. The graph of tangent increases and decreases across these asymptotes, while cotangent behaves similarly but is reflected.
- 🔄 To graph tangent and cotangent functions, identify the vertical asymptotes, the period, amplitude (for modified tangent and cotangent), and any phase shifts or vertical shifts.
- 📊 The domain of trigonometric functions is all real numbers except where the function is undefined, typically at the vertical asymptotes. The range for tangent and cotangent is all real numbers.
- 🔄 For cosecant and secant functions, which are reciprocals of sine and cosine respectively, the domain excludes the values of x where the original functions would be zero (causing division by zero).
- 📈 When graphing modified trigonometric functions (e.g., y = A sin(Bx + C) + D), adjust the graph according to the amplitude, period, phase shift, and vertical shift, while maintaining the basic shape of the unmodified function.
Q & A
What are the key characteristics of a sine function graph?
-A sine function graph starts at the center and oscillates between a maximum and minimum value, returning to the center. It has a period of 2π and the amplitude determines the maximum and minimum values it reaches.
How does a negative sign affect the graph of a sine function?
-A negative sign in front of a sine function causes the graph to reflect over the x-axis, inverting the peaks and troughs of the graph.
What is the general form of a sine wave equation and what do the components represent?
-The general form of a sine wave equation is y = A sin(Bx + C) + D. Here, A represents the amplitude, B is used to calculate the period, C represents a phase shift, and D is associated with a vertical shift.
How do you find the period of a sine or cosine function?
-The period of a sine or cosine function is found by dividing 2π by the coefficient of x (B). The period represents the length of one complete cycle of the function.
What is the difference between the graphs of y = sin(x) and y = 2sin(x)?
-The graph of y = 2sin(x) has the same shape as y = sin(x), but the amplitude is doubled. This means it oscillates between -2 and 2, instead of -1 and 1 as in y = sin(x).
How does a phase shift affect the graph of a sine function?
-A phase shift affects the starting point of the sine function's cycle. If the phase shift is negative (e.g., -C), the graph shifts to the right by C units; if positive, it shifts to the left.
What are the vertical asymptotes of the tangent function and how do they relate to its period?
-The vertical asymptotes of the tangent function occur at x = (2n + 1)π/2, where n is an integer. The distance between these asymptotes is the period of the tangent function, which is π/B, where B is the coefficient of x in the function.
How does a vertical shift affect the graph of a tangent function?
-A vertical shift moves the entire graph of the tangent function up or down by a constant amount. For example, if the function is y = tan(x) + C, where C is the vertical shift, the graph will move up by C units if C is positive, and down by C units if C is negative.
What is the domain and range of the tangent function?
-The domain of the tangent function excludes the vertical asymptotes, so x cannot be (2n + 1)π/2 where n is an integer. The range of the tangent function is all real numbers, from negative infinity to infinity.
How does the graph of the cotangent function compare to the tangent function?
-The cotangent function is the reciprocal of the tangent function. While the tangent function has vertical asymptotes, the cotangent function has horizontal asymptotes at y = 0 and y = π. The cotangent function increases where the tangent function decreases and vice versa.
What are the key differences between the graphs of secant and cosecant functions?
-The secant function is the reciprocal of the cosine function, while the cosecant function is the reciprocal of the sine function. Both have vertical asymptotes where the corresponding sine or cosine function touches the x-axis. The range of both functions is from negative infinity to infinity, but they have different domains, excluding the asymptotes.
Outlines
📈 Introduction to Graphing Trigonometric Functions
The video begins with an introduction to graphing trigonometric functions, focusing on sine, cosine, secant, cosecant, tangent, and cotangent. It explains how to identify amplitude, period, and vertical shifts, and emphasizes the importance of understanding these concepts for successful graphing. The video also discusses the generic form of a sine wave and how to calculate the period of sine and cosine waves.
📊 Graphing Sine and Cosine Functions
This section delves into the specifics of graphing sine and cosine functions. It explains how to plot points for a sine wave and discusses the effects of positive and negative sine and cosine functions on the graph. The video also covers how to calculate the period and amplitude of these functions and provides a step-by-step guide on how to graph them, including how to handle vertical shifts and the domain and range of these functions.
📈 Graphing Advanced Trigonometric Functions
The video continues with advanced concepts in trigonometric graphing, including how to graph functions with different amplitudes, periods, and phase shifts. It provides examples of graphing y = 2 sine X and y = 2 cosine X, explaining how changes in the function's parameters affect the graph. The section also introduces the concept of vertical and phase shifts, and how they alter the graph of the function.
📊 Graphing Secant and Cosecant Functions
This part of the video focuses on graphing secant and cosecant functions. It explains that these functions are the reciprocals of cosine and sine, respectively, and thus have similar graphing rules but with key differences. The video demonstrates how to plot these functions, including their asymptotes and the effects of vertical shifts on their graphs. It also discusses the domain and range of these functions.
📈 Graphing Tangent and Cotangent Functions
The video concludes with a discussion on graphing tangent and cotangent functions. It highlights the unique characteristics of these functions, such as their vertical asymptotes and the differences in their periods compared to sine and cosine functions. The video provides a step-by-step guide on how to graph these functions, including handling phase shifts and vertical stretches or compressions. It also covers the domain and range considerations for tangent and cotangent functions.
Mindmap
Keywords
💡Trigonometric Functions
💡Amplitude
💡Period
💡Vertical Shift
💡Phase Shift
💡Graphing
💡Sine Function
💡Cosine Function
💡Tangent Function
💡Cotangent Function
Highlights
The video focuses on graphing trigonometric functions, including sine, cosine, secant, cosecant, tangent, and cotangent.
Amplitude, period, phase shifts, and vertical shifts are discussed as key features of trigonometric functions.
The graph of negative sine starts at the center and goes down first, then up, reflecting the positive sine graph over the x-axis.
Positive cosine starts at the top and goes down to the middle, then back up, unlike sine which starts at the center.
Negative cosine reflects the positive cosine graph over the x-axis, starting at the bottom and going up and down.
The amplitude of a function like y = A * sin(BX + C) + D is represented by the coefficient A.
The period of a sine or cosine function is calculated as 2π divided by B, where B is the coefficient in front of X.
Phase shifts are calculated by setting X + C equal to zero and solving for X.
Vertical shifts are represented by the constant D in the equation y = A * sin(BX + C) + D, shifting the graph up or down.
The graph of y = sin(QX) has an amplitude of 1 and a period of 5, plotted by finding intervals and plotting key points.
The graph of y = sin(X + 1) is shifted up by one unit, with the range varying between 0 and 2.
For y = 2 * sin(X) - 1, the period is 2π, and the range oscillates between -3 and 1.
The graph of 3 * cos(X) + 2 has a period of 2π, amplitude of 3, and range from -1 to 5.
The function y = -5 * sin(X) + 3 has a period of 2π, a vertical shift of +3, and a range from -2 to 8.
The graph of y = 2 * sin(π * X) has a period of 2, amplitude of 2, and range from -2 to 2.
The function y = -4 * cos(π/4 * X + 2) has a period of 8, a vertical shift of +2, and range from -2 to 6.
The graph of y = 5 - 3 * sin(1/2 * X) involves a phase shift, period calculation, and range determination.
Cosecant is 1 divided by sine and shares similar rules and periods with sine, but with vertical asymptotes where sine touches the x-axis.
Secant is 1 divided by cosine, with a period of 2π and vertical asymptotes where cosine touches the x-axis.
The graph of tangent has two key vertical asymptotes at π/2 and -π/2, with a period calculated as π divided by the coefficient in front of X.
Cotangent is similar to tangent but with different vertical asymptotes at 0, π, and 2π, and a period of π divided by the coefficient in front of X.
Transcripts
Browse More Related Video

Graphing Sine, Cosine, Cosecant, Secant, Tangent & Cotangent (Complete Guide)

How to Graph Cosecant and Secant (Precalculus - Trigonometry 15)
Graphing Transformations with Sine and Cosine (Precalculus - Trigonometry 12)
How To Graph Trigonometric Functions | Trigonometry

How to Graph Phase Shifts of Trigonometric Functions (Precalculus - Trigonometry 16)

Graphing Transformations with Tangent and Cotangent (Precalculus - Trigonometry 14)
5.0 / 5 (0 votes)
Thanks for rating: