Statistics & Regression on fx-991ES Plus - Calculator Tricks [2020]
TLDRThis video tutorial demonstrates how to perform advanced statistical calculations and regression analysis using a scientific calculator, specifically the SU900s Plus model. The presenter guides viewers through entering data, changing modes, and utilizing various statistical functions to calculate mean, median, mode, and standard deviation. The video also covers how to input frequency data and perform different types of regression, including linear, quadratic, logarithmic, and exponential models. The tutorial is designed to help users efficiently learn and apply statistical calculations for academic or professional purposes, with additional resources provided for further learning.
Takeaways
- 🧮 The video demonstrates how to use a scientific calculator, specifically the SU900S Plus, for advanced statistics and regression analysis.
- 🔢 It begins with a basic statistics problem involving a set of observations and guides the user through finding mean, median, and mode.
- 📱 The process involves changing the calculator's mode to 'statistics 3' and entering data for one-variable statistics.
- ⏎ After data entry, pressing 'AC' is necessary to exit the data input mode and proceed to statistical calculations.
- 📊 The video explains how to calculate the summation of x, mean, standard deviation, and other statistical measures using the calculator.
- 🔗 Links to additional videos on distribution and setup are provided for more detailed explanations of those topics.
- 📈 The tutorial also covers how to perform statistical calculations with frequency data, including turning on the frequency option in the calculator's setup.
- 📚 The importance of learning the setup wizard commands is emphasized for efficient use during examinations.
- 📉 The script introduces regression analysis, explaining how to perform linear (a + bx) regression using the calculator.
- 📊 It further explores other types of regression, such as quadratic, logarithmic, and exponential, and guides the user through entering values and calculating coefficients.
- 📝 The video concludes by encouraging feedback and suggesting the creation of more tutorial videos based on viewer requests.
Q & A
What is the main topic of the video?
-The video is about explaining how to perform advanced statistics and regression using a scientific calculator, specifically the SU900s Plus.
Which calculator model is used in the video for demonstrating statistics and regression calculations?
-The SU900s Plus calculator is used in the video.
What are the basic statistical values the video aims to calculate?
-The video aims to calculate statistical values such as mean, median, mode, and standard deviation.
How does one enter data into the calculator for statistical calculations?
-Data is entered by changing the calculator to statistics mode, going into one variable statistics, and inputting the values one by one.
What key combination is used to access the statistical commands on the calculator?
-The key combination to access the statistical commands is 'Shift' and '1'.
How does the video guide users to find the sum of observations?
-The video instructs users to go to statistics, select 'summation x', and then input '2' to find the sum of all observations.
What is the process to calculate the mean of the observations using the calculator?
-To calculate the mean, the user should go to statistics, input '2' for the average function, and then hit 'equals' to get the result.
How can the calculator be used to calculate the standard deviation of a dataset?
-To calculate the standard deviation, the user should go to statistics, input '4' for the standard deviation function, and hit 'E3' to calculate the value.
What additional statistical calculations can be performed on the calculator?
-Additional calculations such as distribution, minimum, maximum, and summation of x squared can be performed using the calculator.
How does the video address the input of frequency in statistical calculations?
-The video explains that the user can turn on the frequency option by pressing 'Shift' and 'Setup', then selecting 'Stat number four' and turning on the frequency.
What type of regression is demonstrated in the video?
-The video demonstrates linear regression (a + bx) and quadratic regression (a + bx + cx^2).
What is the regression equation obtained from the video's example?
-The regression equation obtained in the video's example is 2x - 1 for the linear regression.
How can users find out more about the setup wizard commands on the calculator?
-Users can find more information about the setup wizard commands by watching a separate video on setup, which is linked in the video.
What other types of regression models are mentioned in the video?
-Other types of regression models mentioned in the video include quadratic, logarithmic, and exponential regression.
Outlines
📊 Advanced Statistics and Regression with Scientific Calculator
This paragraph introduces a tutorial on performing advanced statistics and regression analysis using a scientific calculator, specifically the SU900S Plus model. The video will guide viewers through changing calculator modes to solve statistical problems, starting with basic statistics such as finding the mean, median, and mode of a set of observations. The script outlines the process of entering data, using the calculator's one-variable statistics functions, and navigating through the calculator's menu to perform various statistical calculations, including summation, average, standard deviation, and range (minimum and maximum). It also touches on the topic of performing statistical calculations with frequency data and encourages viewers to watch another video for a detailed explanation on setup and distribution calculations.
📈 Regression Analysis Techniques on Scientific Calculator
The second paragraph delves into conducting regression analysis using the scientific calculator. It begins with a linear regression example, demonstrating how to input x and y values and then find the coefficients of the regression equation. The script explains how to navigate the calculator's menu to perform regression calculations and provides an example of a linear regression equation derived from the entered data. Additionally, the paragraph introduces other types of regression models available on the calculator, such as quadratic, logarithmic, and exponential regression. The tutorial encourages viewers to try different regression models and offers to create more videos on specific functions if requested by the audience. The paragraph concludes with a call for feedback and a farewell message.
Mindmap
Keywords
💡Advanced Statistics
💡Regression
💡Scientific Calculator
💡Mode
💡Mean
💡Median
💡Standard Deviation
💡Frequency
💡Coefficient
💡Quadratic Regression
Highlights
Introduction to advanced statistics and regression using a scientific calculator, specifically the SU900S Plus.
Explanation of changing modes and using statistics keys for statistical calculations.
Demonstration of solving basic statistical problems with a set of given observations.
Guidance on finding mean, median, and mode using the calculator's statistical functions.
Instructions on entering data and using the 'AC' button to clear the data entry screen.
How to navigate the calculator's menu to access statistical commands.
Process of calculating the summation of observations using the calculator.
Explanation of how to find the average or mean of a set of observations.
Demonstration of calculating the standard deviation using the calculator.
Introduction to distribution calculations and a link to a separate video for further details.
How to find minimum and maximum values from a dataset using the calculator.
Instructions for performing statistical calculations with frequency data.
Details on setting up the calculator for frequency data input and calculations.
Explanation of how to calculate standard deviation with frequency data.
Process of inputting values and frequencies for statistical analysis.
Introduction to regression analysis and setting up the calculator for it.
How to perform a straight line (a + bx) regression using the calculator.
Demonstration of calculating regression coefficients and the resulting equation.
Exploring different regression models such as quadratic, logarithmic, and exponential.
Instructions for performing a quadratic regression and interpreting the coefficients.
Encouragement for feedback and requests for future video topics.
Transcripts
Browse More Related Video
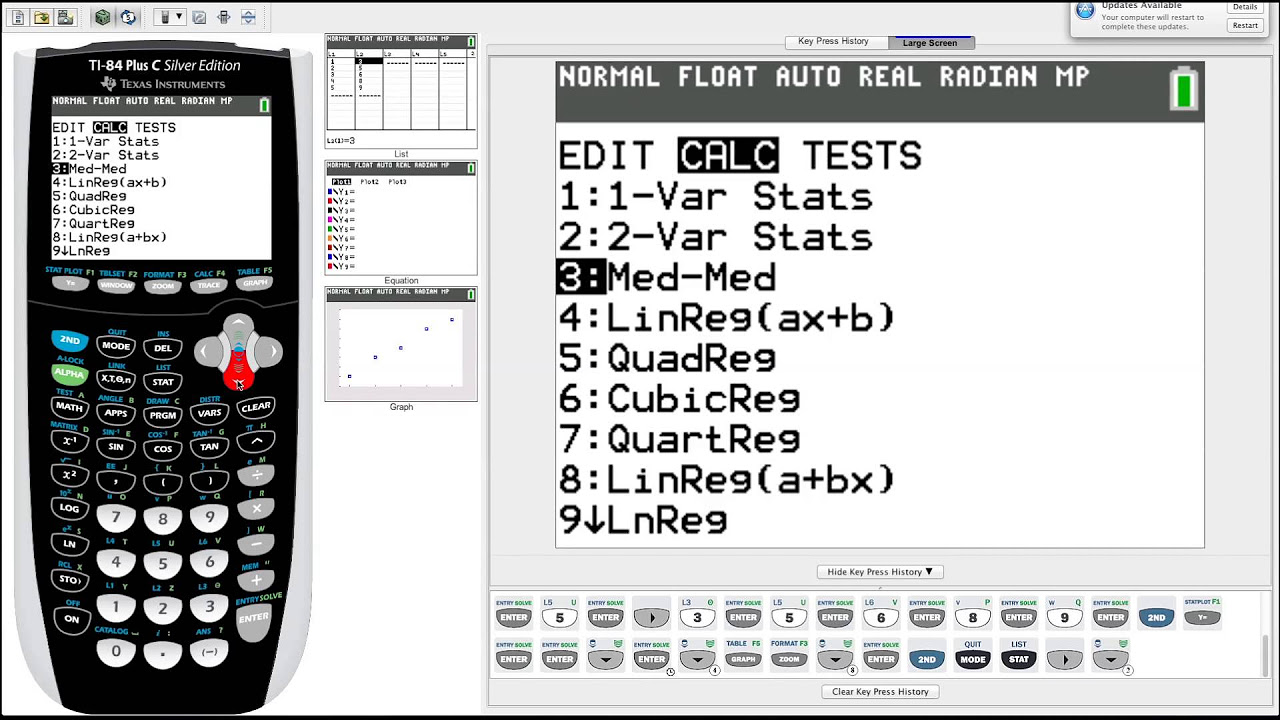
TI-84 Plus Graphing Calculator Guide: Statistics
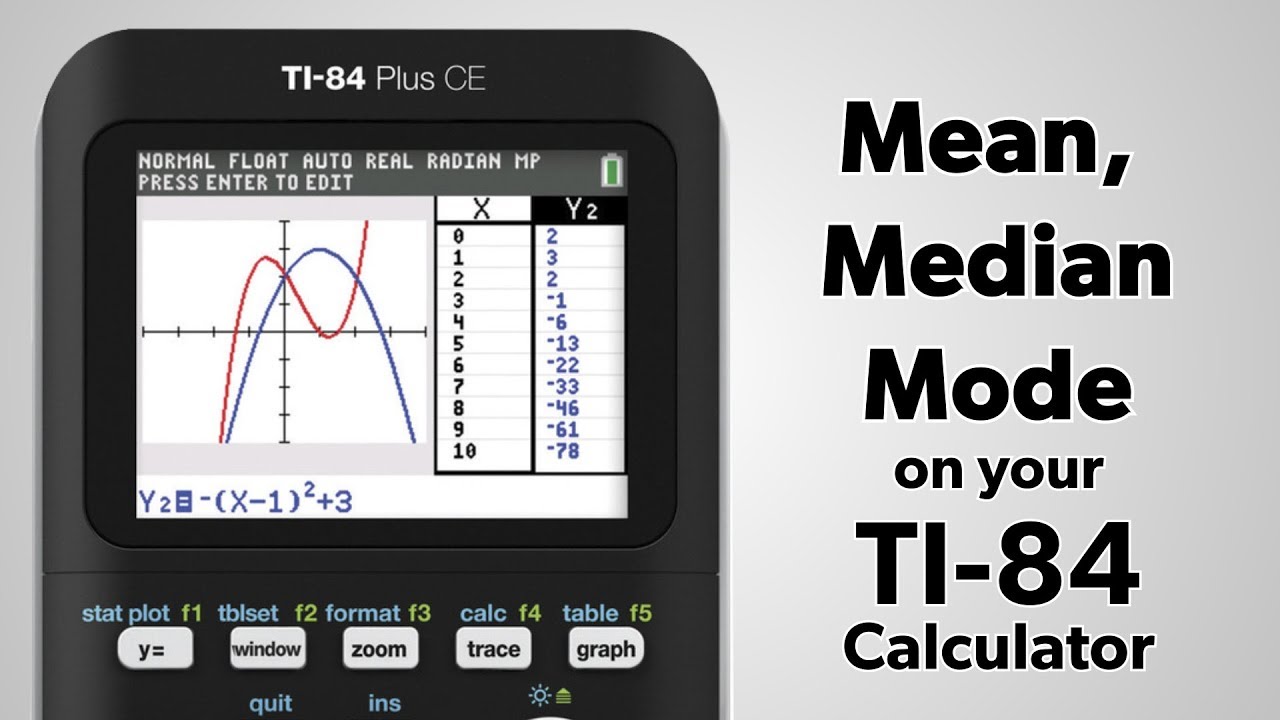
TI-84 Plus: Find the Mean, Median, and Mode

TI 84 Plus CE Mean Median Mode Range
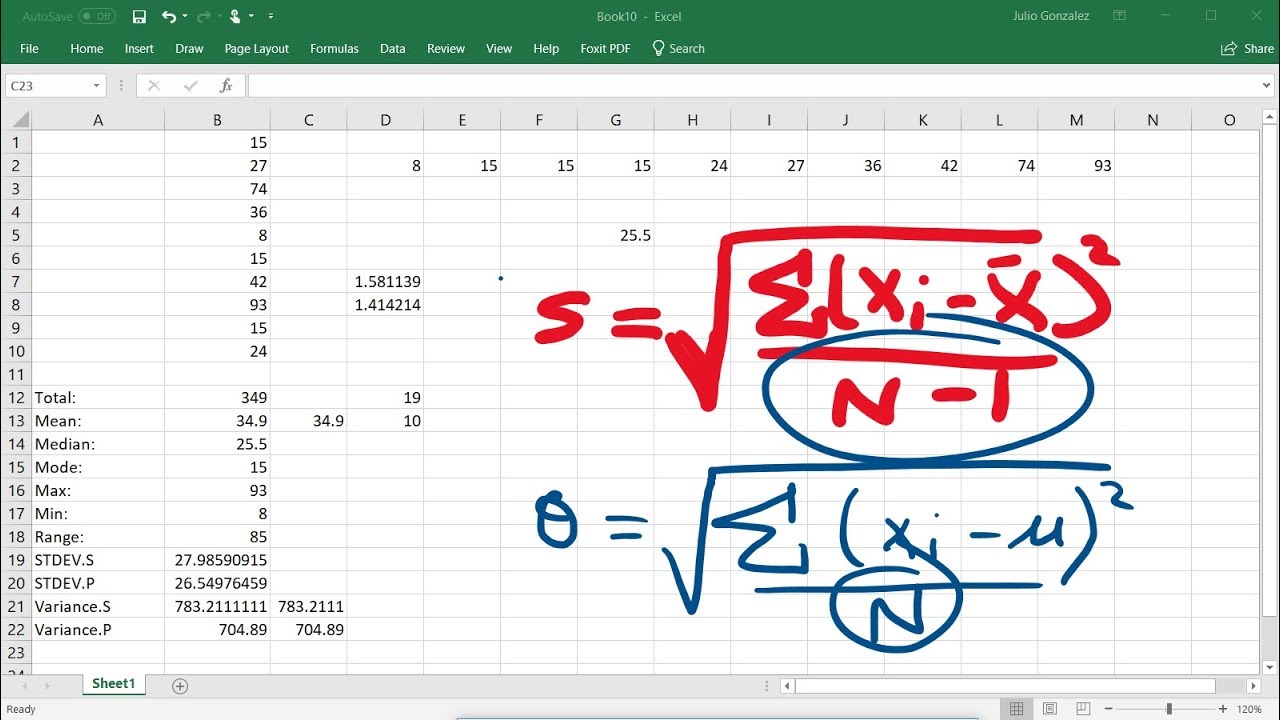
Calculating The Standard Deviation, Mean, Median, Mode, Range, & Variance Using Excel
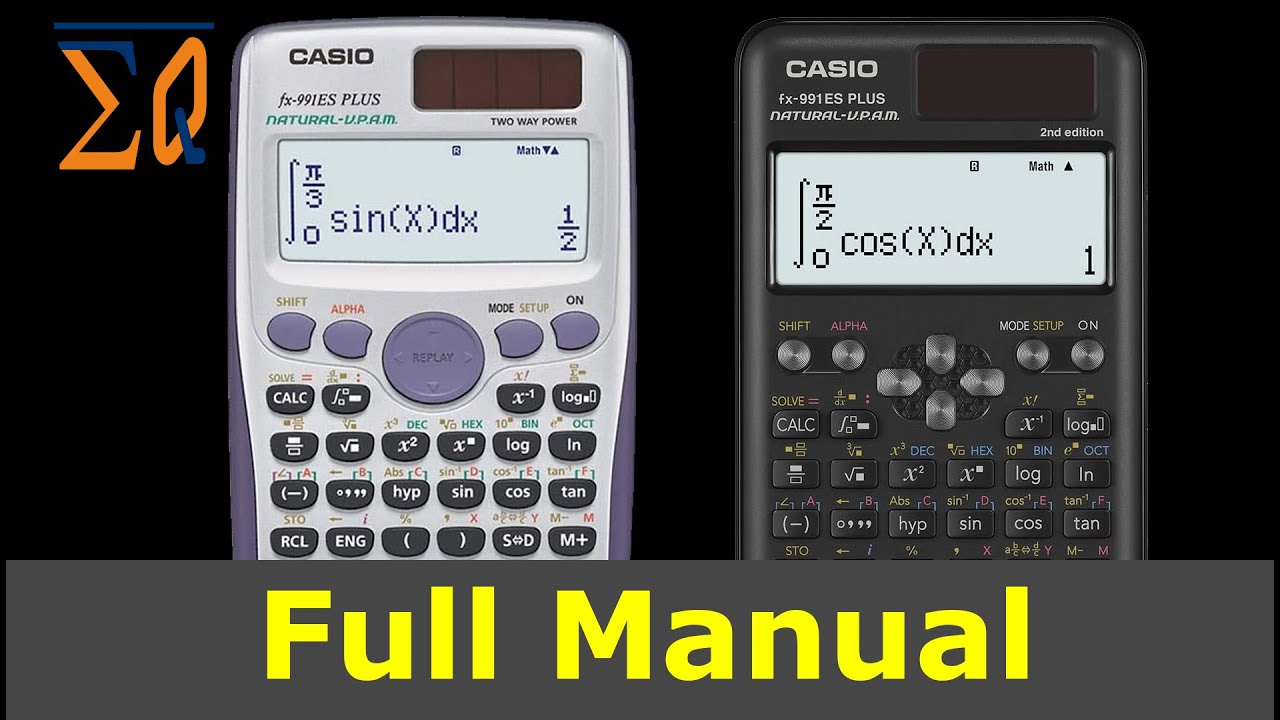
Casio FX-991ES Plus and FX-115ES Plus 2nd Edition, Learn All Features

CASIO FX-991MS FX-570MS FX-100MS and 2nd Edition scientific calculator learn all features
5.0 / 5 (0 votes)
Thanks for rating: