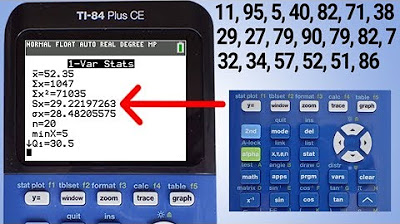
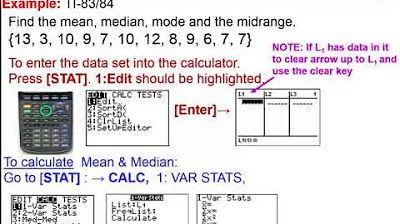
TI 84 Plus CE Mean Median Mode Range
TLDRRob demonstrates how to calculate the mean, median, mode, and range using the TI 84 Plus CE Graphing Calculator. He guides viewers through entering data into a list, clearing lists, and using the calculator's statistical functions to find these measures of central tendency for a set of numbers. The video also shows how to sort the list to easily identify the mode and offers a shortcut to quickly find the mean and median. A must-watch for those looking to master statistical calculations on this calculator.
Takeaways
- 📚 The video is a tutorial on calculating mean, median, mode, and range using a TI 84 Plus CE Graphing Calculator.
- 👕 The presenter, Rob, promotes his math-related T-shirts available on Amazon, with a link provided in the description.
- 📈 The script introduces the concept of Measures of Central Tendency, which includes mean, median, and mode.
- 🔢 The tutorial uses a list of 10 numbers: 31, 10, 2, 31, 87, 100, 14, 31, 55, and 49, to demonstrate the calculations.
- 🛠️ The presenter demonstrates how to clear an existing list (L1) on the calculator using the 'Clear List' function.
- 📝 The process of entering the numbers into the L1 list on the calculator is shown step by step.
- 🔄 The video explains two methods to calculate the Measures of Central Tendency: using the 'One Variable Stats' function and a shortcut method.
- 📊 The mean of the numbers is calculated to be 41, and the sum of all numbers is 410, indicating there are 10 values in the list.
- 📉 The minimum and maximum values in the list are identified as 2 and 100, respectively, which gives the range of the data set.
- 🎯 The median is found to be 31, which is the middle number in the sorted list.
- 🔑 The mode, the number that appears most frequently, is also 31, which appears three times in the list.
- ➡️ The video concludes with a shortcut method for finding the mean and median directly from the list using the calculator's built-in functions.
Q & A
What are the Measures of Central Tendency discussed in the video?
-The Measures of Central Tendency discussed are mean, median, mode, and range.
How do you access the list feature on the TI 84 Plus CE Graphing Calculator?
-You access the list feature by pressing the 'Stat' button and selecting 'Edit' by pressing the '1' button or 'Enter'.
What is the process to clear a list on the TI 84 Plus CE Graphing Calculator?
-To clear a list, press the 'Stat' button, go to '4: Clear List', press 'Enter', then press the '2nd' button followed by the '1' key to select L1, and finally press 'Enter' to clear the list.
How can you enter numbers into the L1 list?
-To enter numbers into the L1 list, press the 'Stat' button, go to 'Edit', and type each number followed by pressing 'Enter'.
How do you calculate the mean using the TI 84 Plus CE Graphing Calculator?
-To calculate the mean, press the 'Stat' button, go to 'Calc', select '1-Var Stats', ensure the list is set to L1, and press 'Enter'. The mean will be displayed as 'x bar'.
How do you find the median of the numbers in L1?
-The median can be found by running '1-Var Stats' from the 'Calc' menu. It will be displayed in the results as 'Med'.
What is the range of the numbers provided in the script?
-The range of the numbers is from the minimum value (2) to the maximum value (100).
What steps should be followed to sort the list in ascending order?
-To sort the list in ascending order, press the 'Stat' button, select 'SortA', enter 'L1' by pressing '2nd' then '1', and press 'Enter'.
How can the mode be determined from the sorted list?
-The mode can be determined by looking at the sorted list and identifying the number that appears most frequently, which in this case is 31.
How do you quickly find the mean and median using the 'List' feature?
-To quickly find the mean and median, press '2nd' then 'List' (Stat button), go to 'Math', select 'Mean' or 'Median', enter 'L1', close the parenthesis, and press 'Enter'.
Outlines
📊 Calculating Central Tendency on TI 84 Plus CE
Rob introduces a tutorial on calculating statistical measures like mean, median, mode, and range using the TI 84 Plus CE Graphing Calculator. He mentions his math T-shirts on Amazon and provides a list of 10 numbers to demonstrate the process. The steps include clearing an existing list, entering new numbers, and using the calculator's statistical functions to find the measures of central tendency. The mean is calculated to be 41, the sum of the numbers is 410, and the range is from 2 to 100. The median and mode are both identified as 31, with the mode determined by sorting the list in ascending order.
🔢 Finding Mean and Median with List Feature Shortcut
In the second paragraph, Rob demonstrates an alternative method to quickly find the mean and median using the TI 84 Plus CE's list feature shortcut. He sorts the list L1 to identify the mode, which is 31 appearing three times, and also serves as the median. Rob then uses the calculator's Math menu to directly calculate the mean from the list, confirming it to be 41. The video concludes with an invitation for viewers to like, subscribe, and support the channel.
Mindmap
Keywords
💡Mean
💡Median
💡Mode
💡Range
💡Measures of Central Tendency
💡TI 84 Plus CE Graphing Calculator
💡List Feature
💡Stat Button
💡Edit
💡Sort Ascending
💡Clear List
Highlights
Introduction to calculating mean, median, mode, and range using the TI 84 Plus CE Graphing Calculator.
Promotion of math T-shirts available on Amazon with a link in the description.
Explanation of the terms mean, median, and mode as Measures of Central Tendency.
Demonstration of using the List feature on the calculator for statistical calculations.
Guidance on entering numbers into the L1 List on the calculator.
Instructions on how to delete a list and clear the L1 List for new data entry.
Quick method to clear a list by using the Clear Button and cursor navigation.
Entering the provided set of numbers into the L1 List for analysis.
Overview of calculating Measures of Central Tendency using the calculator's Calc feature.
Step-by-step guide to selecting One Variable Stats for statistical calculations.
Correction of list selection error from L2 to L1 for accurate calculations.
Presentation of calculated mean, sum, number of values, and range from the calculator.
Identification of the minimum and maximum values to determine the range.
Explanation of how to find the median by identifying the middle number in the sorted list.
Discussion on the mode as the most frequently occurring number in the list.
Tutorial on sorting the L1 list in ascending order to facilitate mode identification.
Observation that the mode (31) coincides with the median in the given data set.
Shortcut method to calculate the mean and median directly from the List feature.
Final summary of how to find Measures of Central Tendency using the TI 84 Plus CE Graphing Calculator.
Call to action for viewers to like, give a thumbs up, and subscribe to the channel.
Transcripts
Browse More Related Video

TI-84 Plus: Find the Mean, Median, and Mode

TI84 Plus CE Range, Variance and Standard Deviation

TI-84 Plus Graphing Calculator Guide: Statistics

Calculating The Standard Deviation, Mean, Median, Mode, Range, & Variance Using Excel

Elementary Statistics - Chapter 3 Describing Exploring Comparing Data Measure of Central Tendency

Statistics & Regression on fx-991ES Plus - Calculator Tricks [2020]
5.0 / 5 (0 votes)
Thanks for rating: