Graphing Natural logarithmic functions and Exponential Functions
TLDRThis lesson delves into the art of graphing natural logarithm and exponential functions with base e. The instructor emphasizes that the principles from earlier sections apply here, highlighting the similarities in graphing techniques between regular and natural logs, as well as between exponential functions with different bases. Through step-by-step examples, the video demonstrates how to find key points and asymptotes for functions like e^(x-2)+3 and ln(x-1)+2. The instructor illustrates the process of determining domain and range, and guides viewers in plotting these functions, reinforcing the idea that understanding the fundamental principles of graphing is crucial for tackling more complex mathematical functions.
Takeaways
- 📊 The lesson focuses on graphing natural log functions and exponential functions with base e.
- 📚 The principles for graphing regular logs and exponential functions apply to natural logs and e-based exponentials.
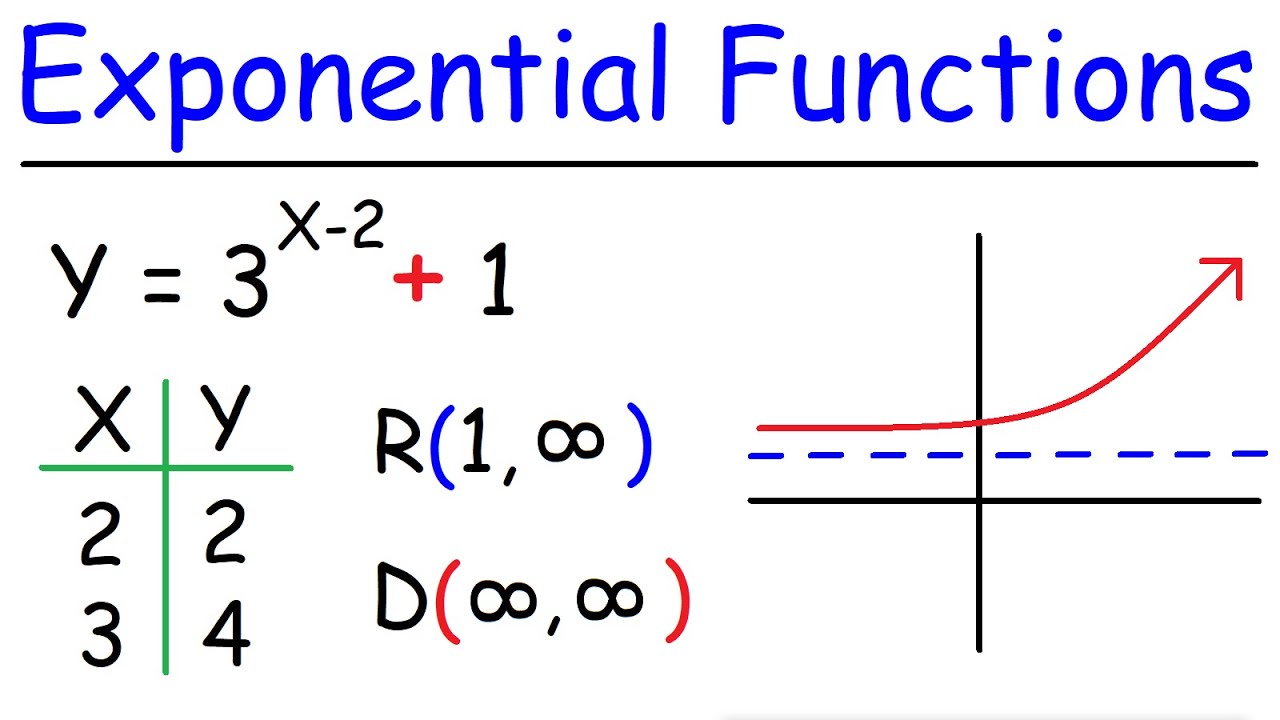
- 🔍 To graph e^x - 2 + 3, set the exponent equal to zero and one, then create a table.
- 🧮 For e^x - 2 + 3, the horizontal asymptote is y = 3.
- ✏️ When x is 2, y equals 4; when x is 3, y is approximately 5.7.
- 📈 The domain of e^x - 2 + 3 is all real numbers, and the range is from 3 to infinity.
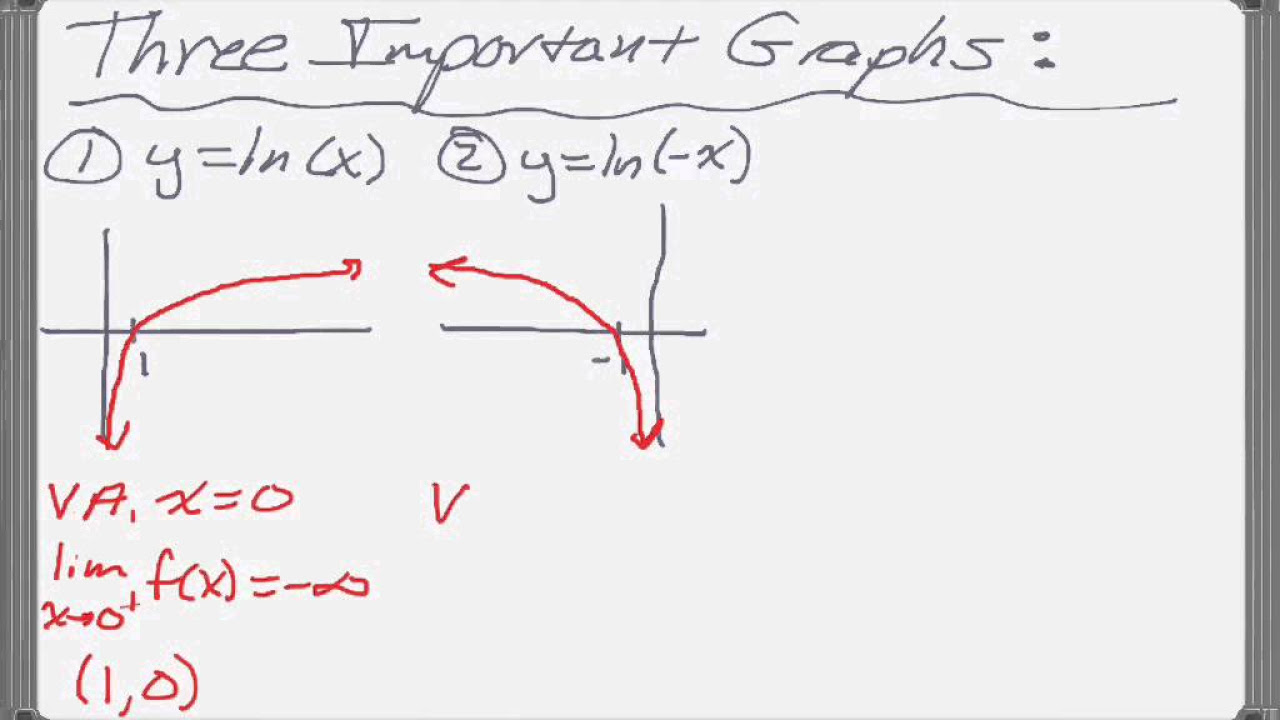
- 📝 For ln(x - 1) + 2, set the inside part equal to zero, one, and e to find the values of x.
- 🛑 The vertical asymptote for ln(x - 1) + 2 is at x = 1.
- 🔢 When x is 2, y equals 2; when x is approximately 3.7, y equals 3.
- 📉 The domain of ln(x - 1) + 2 is from 1 to infinity, and the range is all real numbers.
Q & A
What is the main focus of the lesson?
-The lesson focuses on graphing natural log functions and exponential functions with the base e.
How is the graphing of natural log functions similar to regular log functions?
-The graphing techniques used for regular log functions are the same as those used for natural log functions, with the only difference being the base e for natural logs.
What is the significance of setting the exponent to zero and one when graphing exponential functions?
-Setting the exponent to zero and one helps determine key points on the graph, such as the horizontal asymptote and specific y-values for given x-values.
What is the horizontal asymptote for the function e^(x-2)+3?
-The horizontal asymptote for the function e^(x-2)+3 is y = 3, which is determined by the constant term in the function.
What are the x-values chosen to find specific points on the graph of e^(x-2)+3?
-The x-values chosen are 2 and 3, which come from solving the exponent for x to be zero and one, respectively.
What is the y-value of the function e^(x-2)+3 when x is equal to 2?
-When x is equal to 2, the y-value is 4, as e^(0) is 1 and 1 + 3 equals 4.
How is the y-value calculated when x is equal to 3 for the function e^(x-2)+3?
-When x is equal to 3, the y-value is approximately 5.7, calculated as e^(1) which is about 2.7, and 2.7 + 3.
What is the domain and range of the function e^(x-2)+3?
-The domain of the function e^(x-2)+3 is all real numbers from negative infinity to infinity, and the range is from 3 to infinity.
What is the vertical asymptote for the natural log function ln(x-1)+2?
-The vertical asymptote for the natural log function ln(x-1)+2 is x = 1, as this is where the argument of the natural log becomes zero.
How are the x-values determined for the natural log function ln(x-1)+2?
-The x-values are determined by setting the inside of the log function to zero, one, and e, which are key points for graphing.
What are the y-values for the natural log function ln(x-1)+2 at specific x-values?
-The y-values are found by plugging in the specific x-values into the function. For example, when x = 2, y = 2, and when x = e + 1, y = 3.
What is the domain and range of the natural log function ln(x-1)+2?
-The domain of the natural log function ln(x-1)+2 is from 1 to infinity, and the range is all real numbers from negative infinity to infinity.
Outlines
📈 Graphing Exponential Functions with Base e
This paragraph introduces the process of graphing natural logarithm and exponential functions with base e. The graphing principles from previous sections are applicable here. The example given is the function e^(x-2)+3, where the exponent is set to zero and one to find key points. A table is constructed with x values of 2 and 3, determining the horizontal asymptote at y=3. The y values when x is 2 and 3 are calculated, resulting in points (2,4) and approximately (3,5.7). The graph starts from the asymptote and follows these points, with a domain of all real numbers and a range from 3 to infinity.
📚 Graphing Natural Logarithm Functions
The second paragraph focuses on graphing natural logarithm functions, using the function ln(x-1)+2 as an example. The inside of the function is set to zero, one, and e to find the vertical asymptote at x=1 and other key points. The y values for these points are calculated, resulting in a graph that starts from the vertical asymptote and follows the points (2,2) and approximately (3.7,3). The domain is from x=1 to infinity, and the range is all real numbers from negative infinity to infinity, showcasing that the techniques for graphing regular log functions apply to natural logs as well.
Mindmap
Keywords
💡Graphing
💡Natural Log Functions
💡Exponential Functions
💡Base e
💡Horizontal Asymptote
💡Vertical Asymptote
💡Domain
💡Range
💡Table of Values
💡Graphing Points
💡Asymptotic Behavior
Highlights
Lesson focuses on graphing natural log functions and exponential functions with base e.
Principles from previous sections apply to graphing natural logs and exponential functions.
Graphing a regular log is similar to graphing a natural log.
Graphing 2 to the x is analogous to graphing e to the x.
Example graphing e to the (x - 2) + 3 begins with setting the exponent to zero and one.
Horizontal asymptote for e to the x minus two plus three is y equals three.
Y value when x is 2 is 4, found by e to the zero plus 3.
Y value when x is 3 is approximately 5.7, calculated using e to the one plus 3.
Domain for the graph is all real numbers from negative infinity to infinity.
Range for the graph is from 3 to infinity, based on the y values.
Example with natural log function ln(x - 1) + 2 involves setting the inside to zero, one, and e.
Vertical asymptote for ln(x - 1) + 2 is at x equals 1.
Point (2, 2) is found by plugging in x equals 2 into the natural log function.
Point (e + 1, 3) is derived from x equals e + 1 in the natural log function.
Range for the natural log graph is all real numbers from negative infinity to infinity.
Domain for the natural log graph is from 1 to infinity.
Techniques for graphing regular log functions apply to natural log functions, with consideration of e.
Techniques for graphing 2 to the x are transferable to graphing e to the x.
Transcripts
5.0 / 5 (0 votes)
Thanks for rating: