How To Graph Exponential Functions
TLDRThis video lesson focuses on graphing exponential functions, emphasizing the selection of key points and understanding the concept of horizontal asymptotes. The instructor demonstrates how to plot basic exponential functions, such as 2^x and 3^x, and those with modifications like 1/3^x and 3^(x-2) + 1. The domain and range of these functions are discussed, highlighting that the domain is all real numbers while the range varies from zero to infinity, depending on the function's specific form. The lesson concludes with a review of four generic shapes of exponential functions, illustrating their paths through the coordinate plane based on the signs of x and y values.
Takeaways
- 📈 Exponential functions are graphs that increase or decrease at a rate that accelerates or decelerates, depending on the base of the exponent.
- 🔍 To graph an exponential function, start by identifying key points such as the y-intercept and other significant points based on given x-values.
- 💺 The horizontal asymptote is a key feature of exponential graphs, representing the baseline where the function approaches but never touches, with y equal to zero.
- 🌟 The domain of all exponential functions is all real numbers, meaning that the x-values can range from negative infinity to positive infinity.
- 🚀 The range of an exponential function is influenced by the horizontal asymptote and can vary from (0, ∞) to (-∞, 5) depending on the specific function.
- 📌 When graphing, it's important to consider whether the function is increasing or decreasing, which is determined by the sign of the exponent's base.
- 🔄 Exponential functions can reflect over different axes depending on the sign of the base and exponent, affecting their direction towards certain quadrants.
- 🔢 For functions with a negative base, the graph will reflect over the x-axis or y-axis, depending on the exponent's sign, and will travel towards the appropriate quadrants.
- 📈📌 The shape of the graph can be remembered with a mnemonic: positive x towards the right and positive y upwards for quadrant 1, negative x to the left and positive y up for quadrant 2, positive x right and negative y down for quadrant 4, and both negative for quadrant 3.
- 📝 When the exponent is within a function (e.g., 3^(x-2)), solving for x in relation to the exponent's base helps determine the shape and key points of the graph.
- 📊 Graphing multiple examples of exponential functions helps to understand the general shapes and behaviors of these types of graphs and how they can vary.
Q & A
What is the primary focus of the lesson discussed in the transcript?
-The primary focus of the lesson is graphing exponential functions and understanding their key characteristics, such as the domain, range, and horizontal asymptotes.
How many points are typically needed to graph an exponential function?
-Two points are typically needed to graph an exponential function, which are usually chosen as x-values that correspond to y-values of 0 and 1.
What is the significance of the horizontal asymptote in the context of exponential functions?
-The horizontal asymptote represents the limit that the function approaches as x values increase or decrease. It is a key feature in understanding the long-term behavior of the function. In most cases for exponential functions, the horizontal asymptote is the x-axis (y = 0), indicating that the function approaches but never touches the x-axis as x approaches infinity or negative infinity.
What is the domain of all exponential functions discussed in the transcript?
-The domain of all exponential functions discussed is all real numbers, meaning that there are no restrictions on the input values for x.
What is the range of the exponential function y = 2^x?
-The range of the function y = 2^x is from 0 to infinity (0, ∞), as the function starts at the y-intercept (0,1) and increases without bound.
How does the graph of y = 1/(3^x) differ from y = 2^x in terms of its shape?
-The graph of y = 1/(3^x) is the reflection of the graph of y = 3^x over the y-axis. It starts from the x-axis (y-intercept at (0,1)) and decreases towards the right, unlike y = 2^x which increases towards the right.
What are the two x-values used to graph the function y = 3^(x-2) + 1?
-The two x-values used to graph the function y = 3^(x-2) + 1 are x = 2 and x = 3, which correspond to the points (2,2) and (3,4) respectively.
What is the horizontal asymptote for the function y = 5 - 2^(3-x)?
-The horizontal asymptote for the function y = 5 - 2^(3-x) is y = 5, as indicated by the constant term in the equation.
How does the range of y = 5 - 2^(3-x) differ from the ranges of the previous functions discussed?
-The range of y = 5 - 2^(3-x) differs from the previous functions in that it includes negative values, extending from negative infinity to 5, whereas the ranges of the other functions were from 0 to infinity or from 1 to infinity.
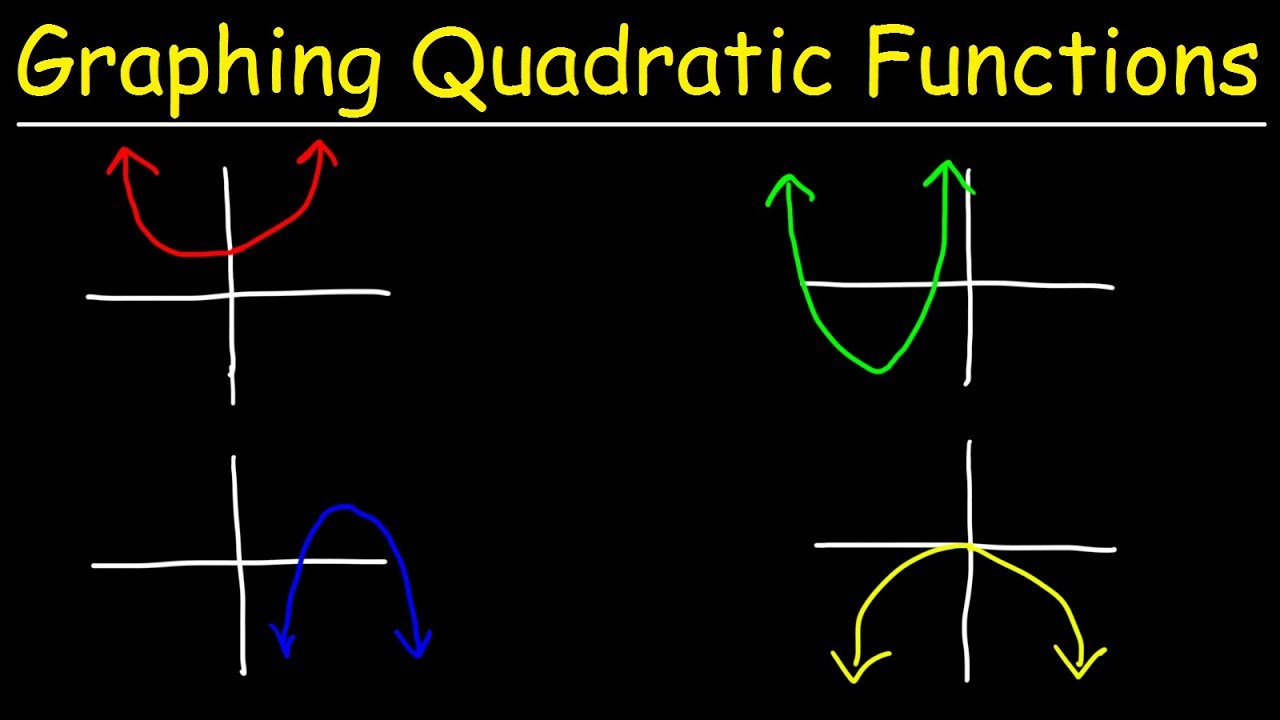
What are the four generic shapes of exponential functions and in which quadrants do they travel?
-The four generic shapes of exponential functions are: 2^x which travels towards quadrant one, 2^(-x) which reflects over the y-axis and travels towards quadrant two, -2^x which reflects over the x-axis and travels towards quadrant four, and -2^(-x) which reflects across the origin and travels towards quadrant three.
How can you remember the direction in which the graphs of the four generic exponential functions travel?
-You can remember the direction by associating positive x and y values with moving towards the right and up (quadrant one), negative x and positive y values with moving towards the left and up (quadrant two), positive x and negative y values with moving towards the right and down (quadrant four), and negative x and y values with moving towards the left and down (quadrant three).
Outlines
📈 Graphing Exponential Functions
This paragraph introduces the concept of graphing exponential functions, emphasizing the selection of two points for illustration. It explains that any number raised to the zero power equals one, and two to the first power is two. The concept of the horizontal asymptote is introduced, noting that if it's not explicitly stated, the horizontal asymptote is the x-axis, where y equals zero. The paragraph details the process of graphing an exponential function, starting from the horizontal asymptote and increasing at an exponential rate. It also discusses the domain and range of the function, clarifying that the domain includes all real numbers and the range extends from zero to infinity, but does not include zero as the graph never touches the horizontal asymptote.
📊 Understanding Asymptotes and Graphing Techniques
This paragraph delves into the specifics of horizontal asymptotes and the graphing process for different exponential functions. It describes how to rewrite a fraction to better understand the function and how to find the points of interest by setting the exponent equal to zero and one. The paragraph then explains how to graph the function with a horizontal asymptote of y equals one, using the points (2,2) and (3,4) as examples. It reiterates that the domain is all real numbers and explains how the range starts from the horizontal asymptote value and extends to infinity. The paragraph concludes with a brief overview of four generic shapes of exponential functions and a mnemonic for remembering their directions based on the signs of x and y values.
🌐 Quadrant Movement of Exponential Graphs
The final paragraph focuses on the movement of exponential function graphs across the quadrants based on the signs of the variables. It explains the directional movement of the graph in relation to the positive or negative values of x and y. The paragraph describes how a positive x value moves towards the right and a positive y value moves upwards, leading the graph towards the first quadrant. Similarly, it details the movement towards the second, third, and fourth quadrants based on the signs of x and y. This mnemonic helps in visualizing the graph's path and understanding the behavior of exponential functions in different scenarios.
Mindmap
Keywords
💡Exponential Functions
💡Graphing
💡Horizontal Asymptote
💡Domain
💡Range
💡Y-Intercept
💡X-Axis
💡Base
💡Reflection
💡Quadrants
💡Graphing Points
Highlights
The lesson focuses on graphing exponential functions, providing a comprehensive guide on how to approach and plot these mathematical functions.
For exponential functions, the domain is all real numbers, indicating that the function is defined for every possible x-value.
The range of an exponential function is from zero to infinity, excluding zero, as the graph never touches the horizontal asymptote.
The concept of horizontal asymptote is introduced, which is the x-axis for functions with an exponential growth rate.
A method for graphing is demonstrated by selecting two points, typically using x values of zero and one, to plot the initial part of the function's graph.
The process of finding the horizontal asymptote for a given exponential function is explained, which helps in understanding the long-term behavior of the function.
An example is provided to graph 1 over 3 raised to the power of x, showcasing how to handle fractional exponents and their graphs.
The concept of reflection is discussed in relation to the graph of exponential functions, with the y-axis and x-axis serving as lines of symmetry.
The impact of a negative sign in front of the base of an exponential function on the graph is explained, noting that it causes the graph to decrease.
A table is suggested as a tool for plotting points on the graph of an exponential function, aiding in visualizing the function's behavior.
Four generic shapes of exponential functions are reviewed, each associated with a different quadrant traversal based on the sign of x and y in their expressions.
A mnemonic is provided to remember the quadrant traversal of exponential functions based on the signs of x and y in their expressions.
The process of graphing exponential functions is emphasized as an essential skill for understanding their mathematical properties and applications.
The lesson outlines the importance of understanding the domain and range of functions, which are fundamental concepts in the study of exponential functions.
The lesson provides a clear and structured approach to graphing, making complex mathematical concepts accessible and easier to understand.
Transcripts
Browse More Related Video
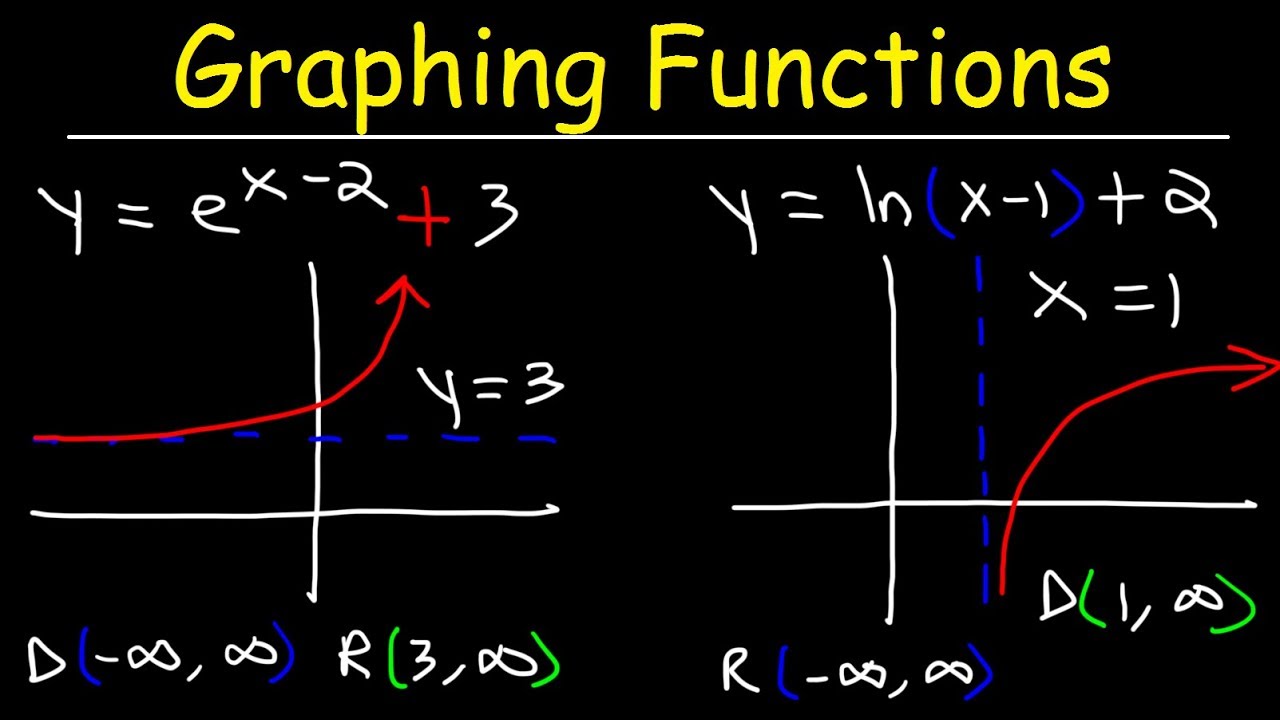
Graphing Natural logarithmic functions and Exponential Functions
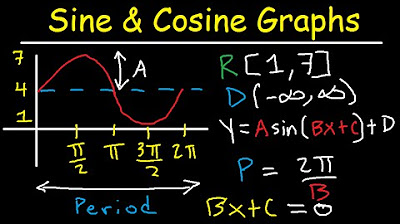
Graphing Sine and Cosine Trig Functions With Transformations, Phase Shifts, Period - Domain & Range
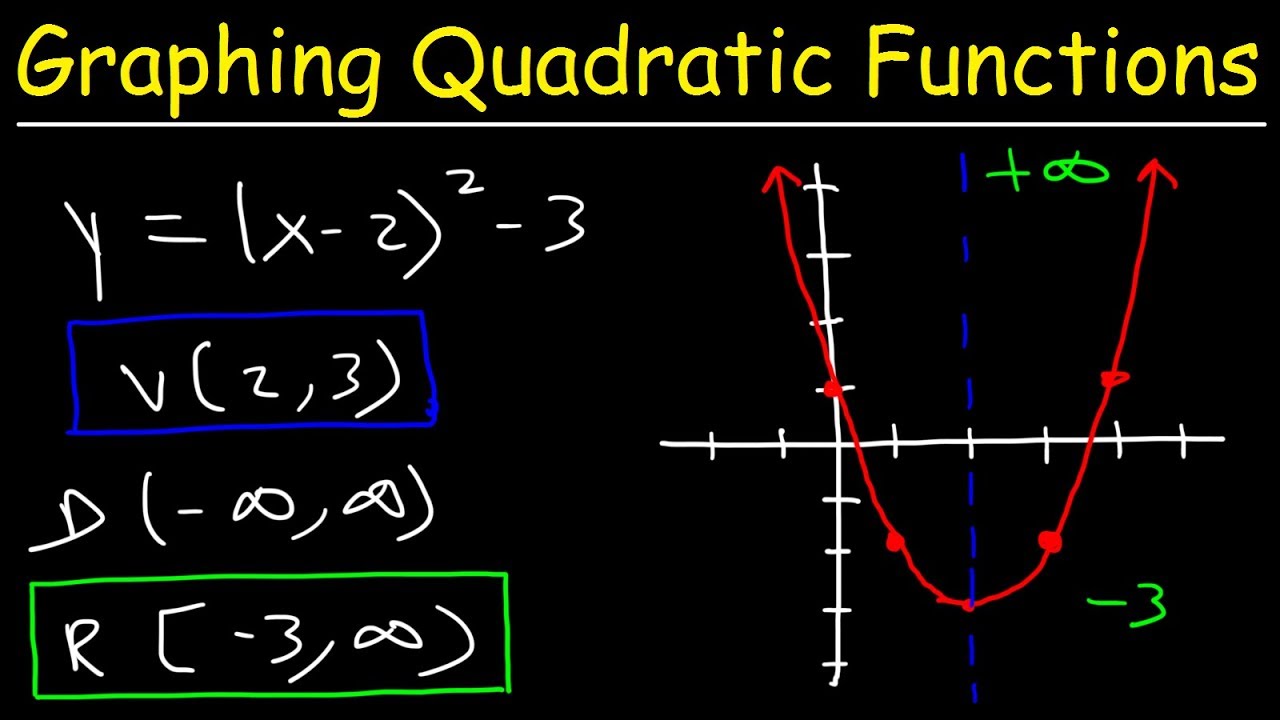
Graphing Quadratic Functions In Vertex Form
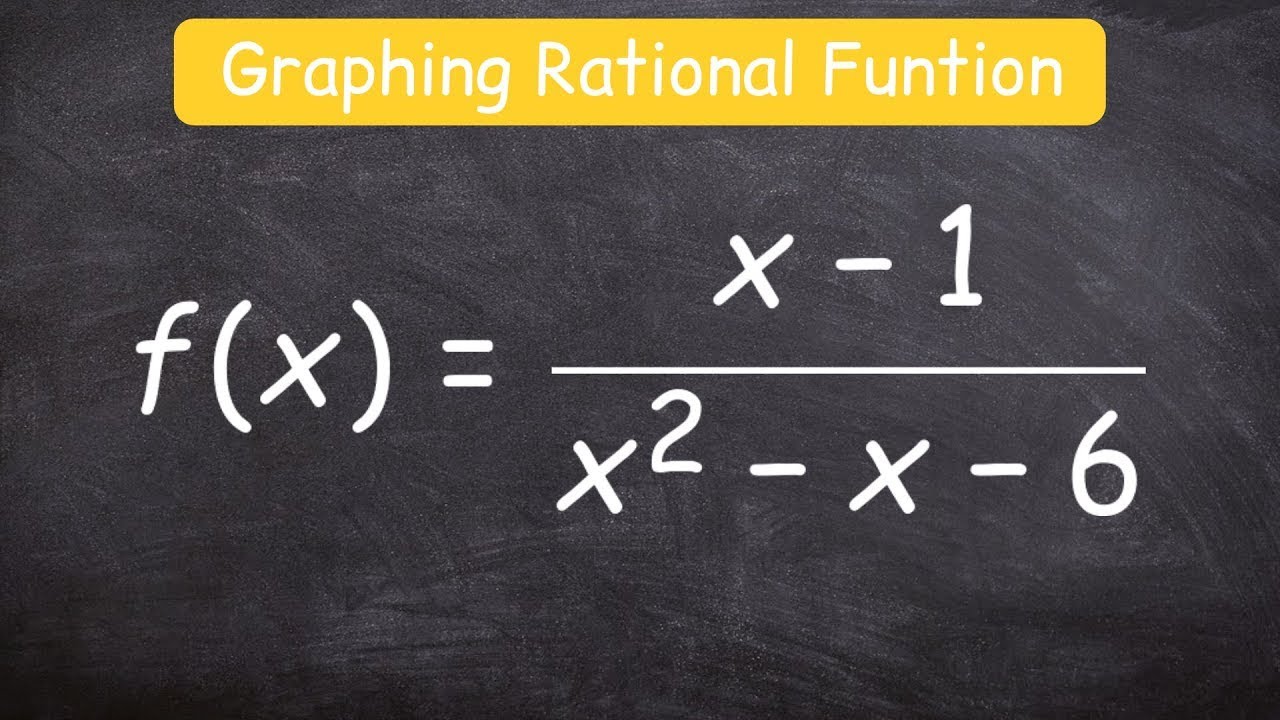
How to graph a rational function using 6 steps
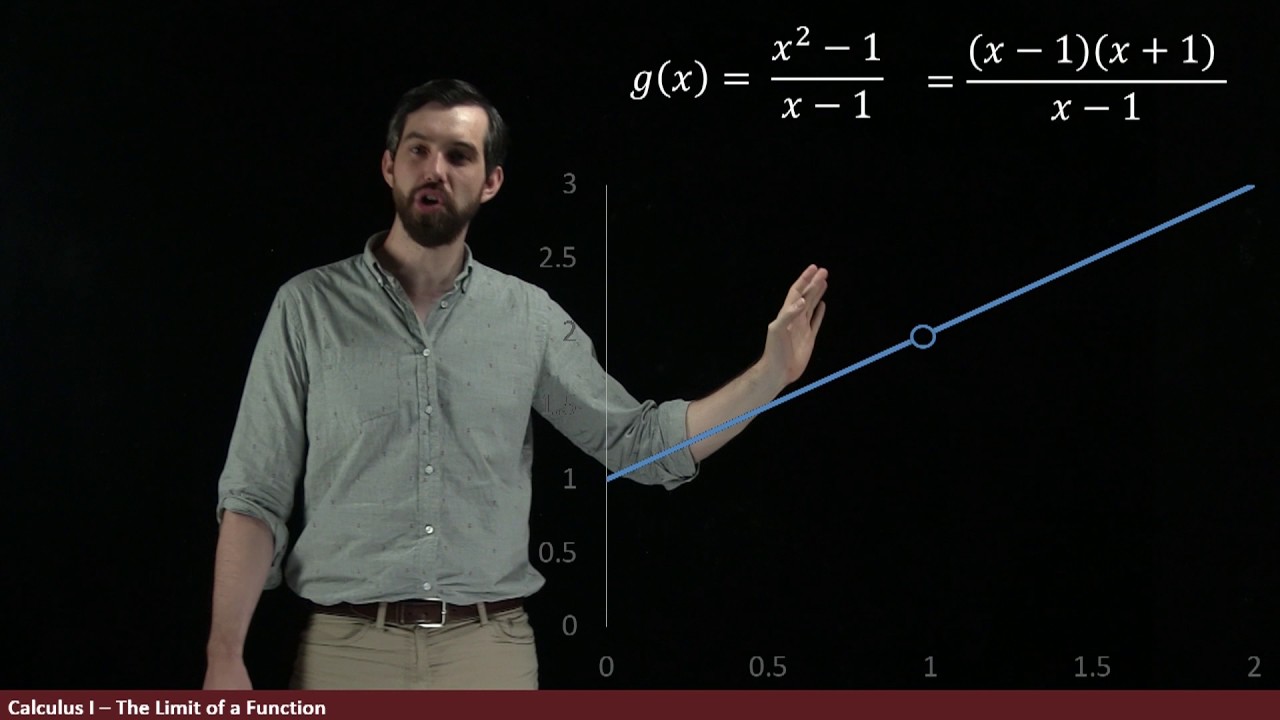
A Tale of Three Functions | Intro to Limits Part I
Graphing Quadratic Functions Using Transformations
5.0 / 5 (0 votes)
Thanks for rating: