Bunnies, Dragons and the 'Normal' World: Central Limit Theorem | The New York Times
TLDRThis script narrates the tale of a brave ecologist studying wild rabbits to illustrate the concept of the central limit theorem. Initially, the ecologist plans to weigh every rabbit, expecting a normal distribution of weights centered around the average. However, due to cost constraints, the plan shifts to random sampling, measuring rabbits in small groups. The script reveals that as sample size increases, the distribution of averages becomes more normal and narrow. Even with non-normal populations, like dragon wingspans, the distribution of sample averages approximates a normal distribution. The video emphasizes the importance of sample size in statistical analysis and the prevalence of the normal distribution in both biology and variable estimates.
Takeaways
- 📚 The concept of normal distribution is introduced, which is a bell-shaped curve where most values are close to the average, with fewer values at the extremes.
- 🐰 The story of an ecologist studying wild rabbits illustrates the normal distribution, where the average weights of rabbits tend to cluster around a mean value.
- 🔍 The ecologist initially plans to measure every rabbit but decides on a more cost-effective approach by measuring rabbits in small, random groups.
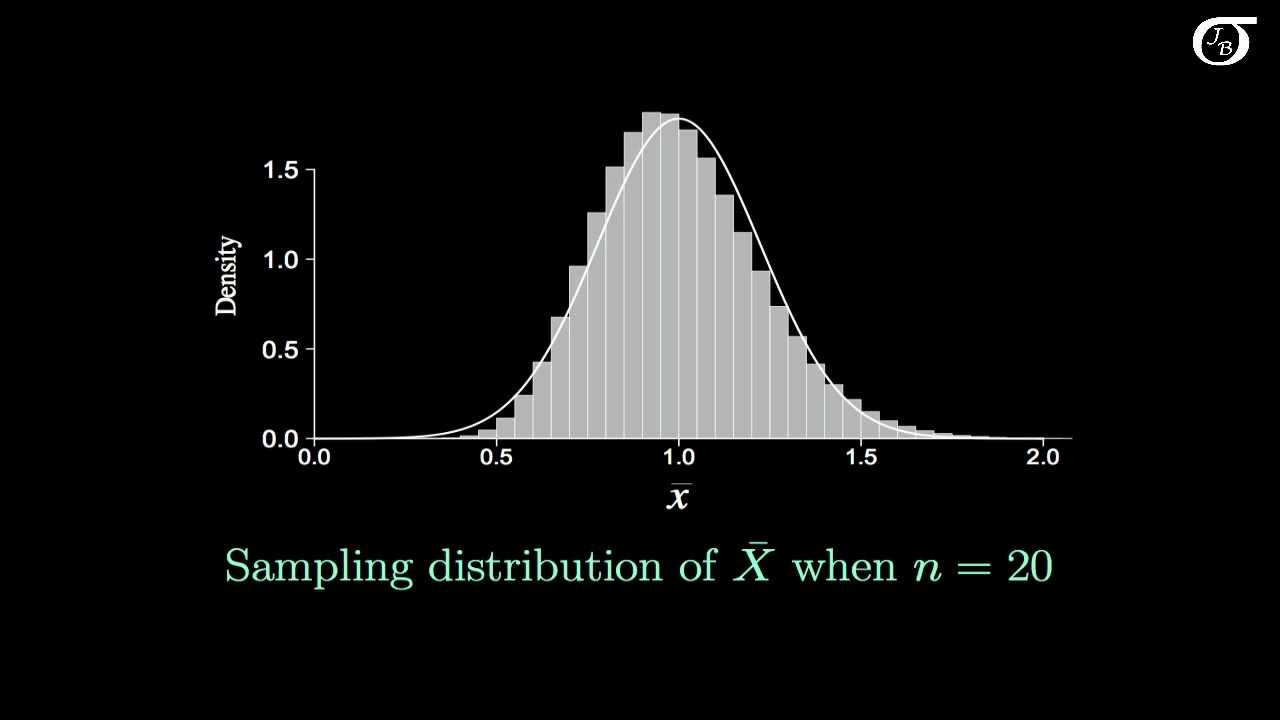
- 📊 As the ecologist increases the sample size from 5 to 20 and then to 100 rabbits, the distribution of average weights becomes more bell-shaped and normal.
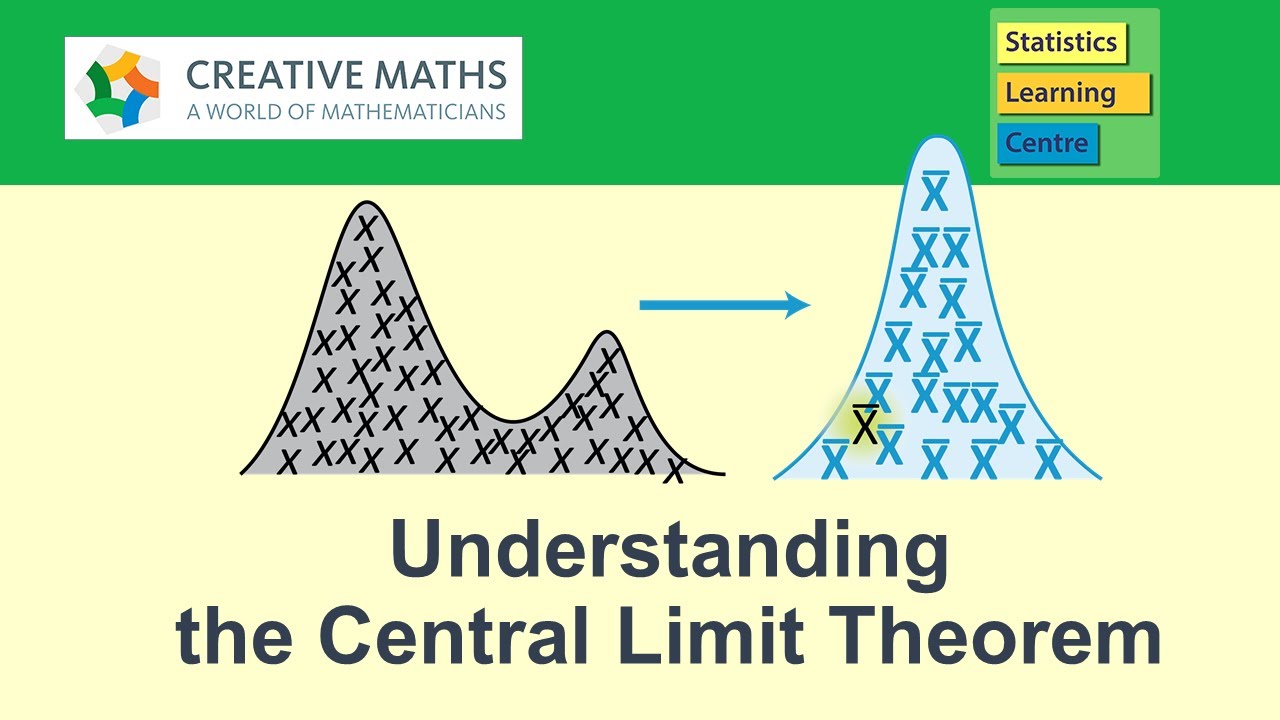
- 🌟 The central limit theorem is demonstrated, showing that the averages of samples from a population will have approximately normal distributions as the sample size increases.
- 📉 The spread of the distribution decreases as the sample size increases, making the distribution of average weights more narrow and closer to the true mean.
- 🐉 The central limit theorem is applicable even when the population distribution is not normal, such as the bodal distribution of dragon wingspans.
- 🔬 The distribution of average wingspans measured from a sample of dragons will still be approximately normal, regardless of the underlying population distribution.
- 📈 The larger the sample size, the closer the distribution of averages will be to a true normal distribution and the narrower the spread.
- 🔑 The importance of sample size in statistical analysis is highlighted, as it affects the accuracy of estimates and the closeness to the true mean.
- 🌐 The video concludes by emphasizing the special role of the normal distribution in various fields, including biology and statistical testing, even when the underlying variables do not follow a normal distribution.
Q & A
What is the concept of normal distribution as described in the script?
-Normal distribution, also known as the bell curve, is a statistical distribution where most values cluster around the average, with fewer values further away from the mean. In the script, it is illustrated using the example of the ecologist studying wild rabbits, noting that most rabbits are close to the average weight, with fewer rabbits being much heavier or lighter.
Why did the ecologist change his initial plan of measuring every rabbit?
-The ecologist had to change his initial plan because it would be too costly and require a large number of carrots to complete. Instead, he opted to measure rabbits in small, randomly chosen groups from the whole population.
What is the central limit theorem and how does it relate to the ecologist's experiment?
-The central limit theorem states that the distribution of sample means will be approximately normal regardless of the distribution of the population, provided the sample size is sufficiently large. The ecologist's experiment demonstrates this by showing that as the sample size increases, the distribution of average weights becomes more normal and the spread decreases.
How does increasing the sample size affect the distribution of averages in the ecologist's study?
-As the ecologist increases the sample size from weighing 5 rabbits at a time to 20, and then to 100, the distribution of average weights becomes more normal and the spread of the distribution decreases, which is a direct application of the central limit theorem.
What happens if the population distribution is not normal, as in the case of dragon wingspans mentioned in the script?
-Even if the population distribution is not normal, such as the bodal distribution of dragon wingspans, the distribution of the average wingspans measured in samples will still be approximately normal. This illustrates the robustness of the central limit theorem.
Why is the sample size important in statistical analysis according to the script?
-Sample size is crucial because a larger sample size leads to a narrower distribution of averages and a closer approximation to the true mean of the population. This is important for the accuracy and reliability of statistical analyses, such as political polls or medical evaluations.
What is special about the normal distribution as highlighted in the script?
-The normal distribution is special because it is not only commonly found in biological measurements but also appears in estimates of variables that do not themselves follow a normal distribution. This allows the normal distribution to be used for testing hypotheses about the world, even when the underlying variables are not normally distributed.
Who created the video and what is the purpose of the video?
-The video was created by Shuy Cho and is brought to you by Creature Cast. The purpose of the video is to explain the concept of the central limit theorem and its importance in statistical analysis using the engaging story of an ecologist studying rabbits and dragons.
How does the script use the story of an ecologist to make the concept of the central limit theorem more understandable?
-The script uses the relatable story of an ecologist studying rabbits and dragons to illustrate the abstract concept of the central limit theorem. By showing how the distribution of averages becomes more normal as sample size increases, the script makes the theorem more tangible and easier to grasp.
What is the significance of the bell-shaped curve in the context of the script?
-The bell-shaped curve, or normal distribution, is significant in the script as it visually represents the central limit theorem. It shows how the distribution of sample averages tends to form a bell shape that becomes more pronounced and narrower as the sample size increases.
What is the role of the character Bikit Patachara in the script?
-Bikit Patachara is the narrator of the script who explains the central limit theorem and its implications in statistical analysis. He provides insights into the importance of sample size and the prevalence of the normal distribution in various fields.
Outlines
🐇 Central Limit Theorem Illustrated with Rabbits
The script introduces the concept of the Central Limit Theorem (CLT) through the story of an ecologist studying wild rabbits. Initially, the ecologist plans to measure every rabbit's weight, expecting a normal distribution where most weights are around the average with fewer extremes. However, due to cost, the plan changes to random sampling. The ecologist begins by weighing small groups of five rabbits, then increases the sample size to twenty and one hundred rabbits at a time. As the sample size grows, the distribution of the average weights becomes more bell-shaped and narrow, illustrating the CLT. The story demonstrates that regardless of the initial distribution, the distribution of sample averages will approximate a normal distribution as sample size increases.
Mindmap
Keywords
💡Ecologist
💡Normal Distribution
💡Average
💡Sample Size
💡Central Limit Theorem
💡Population
💡Sample
💡Distribution
💡Biological Measurement
💡Statistical Analysis
Highlights
A brave ecologist is studying wild rabbits to record their weights.
Observation of rabbits' weights reveals a bell-shaped curve known as normal distribution.
The ecologist has to abandon his initial plan due to its high cost.
A new plan is introduced to measure rabbits in small, randomly chosen groups.
The ecologist measures the average weight of groups of five, twenty, and one hundred rabbits.
As sample size increases, the distribution of average weights becomes more normal and narrower.
The central limit theorem is demonstrated, showing that averages of samples have approximately normal distributions.
Even if the population distribution is not normal, the distribution of average measurements can still be normal.
The study extends to dragons, showing the central limit theorem applies to non-normal distributions as well.
Larger sample sizes result in a distribution of averages that are closer to a truly normal distribution.
The distribution of averages also becomes narrower with larger sample sizes.
The central limit theorem indicates that the average of values drawn from any distribution will be approximately normal.
The sample mean gets closer to the true population mean as the sample size increases.
Sample size is crucial in statistical analysis, such as political polls or medical evaluations.
The normal distribution is special as it often appears in biological measurements and variable estimates.
The video is created by Shuy Cho and brought to you by Creature Cast.
Special thanks are given to Casey Dum, and more stories can be found at creaturecast.org.
Transcripts
Browse More Related Video

Elementary Stats Lesson #13

Central limit theorem | Inferential statistics | Probability and Statistics | Khan Academy
The Central Limit Theorem - understanding what it is and why it works
Introduction to the Central Limit Theorem

Sampling distribution of the sample mean | Probability and Statistics | Khan Academy
The Sampling Distribution of the Sample Mean
5.0 / 5 (0 votes)
Thanks for rating: