What is Degrees Of Freedom in Statistics? Degrees of freedom in Statistics Explained!
TLDRThe video script delves into the statistical concept of 'degrees of freedom,' which is often misunderstood or confusing. It explains that degrees of freedom refer to the number of observations or data points that can vary when estimating statistical parameters. Using the analogy of choosing a mobile phone from a set of ten, the script illustrates how degrees of freedom decrease as choices are made. It further clarifies this concept by discussing its application in estimating the average price of a sample of objects, where knowing the average limits the variability of the last object's price. The script also touches on the impact of degrees of freedom when calculating the standard deviation and in other statistical measures like regression parameters and chi-square tests. The video concludes by encouraging viewers to explore more about kurtosis and skewness, where degrees of freedom play a role, and wishes them health and peace.
Takeaways
- 📚 Degrees of freedom in statistics refer to the number of observations or data points that can vary when estimating statistical parameters.
- 🌐 The concept can be confusing, with definitions ranging from simple hand gestures to complex textbook explanations.
- 📉 Degrees of freedom can be likened to choosing from a set of items, where each choice reduces the number of options available for subsequent selections.
- 🔢 When estimating the average of a sample, the degrees of freedom are reduced by one because the average itself is a fixed point in the calculation.
- 📈 In a sample of five objects with a known average price, the price of the last object is determined by the other four, illustrating the loss of one degree of freedom.
- 📊 When calculating the standard deviation for a sample, the degrees of freedom are adjusted because the sample mean is already known.
- 📚 The formula for standard deviation changes when using sample data instead of population data, reflecting the loss of degrees of freedom.
- 🔍 Degrees of freedom are also important in regression analysis and chi-square tests, depending on what parameters are being estimated.
- 📘 The concept extends to other statistical measures such as kurtosis and skewness, as mentioned in the video.
- 👋 The video concludes with a reminder to stay healthy and peaceful, encouraging viewers to continue learning about applied statistics.
Q & A
What is the concept of 'degrees of freedom' in statistics?
-Degrees of freedom in statistics refer to the number of observations or bits of information in the data that are free to vary when estimating statistical parameters.
Why are degrees of freedom important when estimating statistical parameters?
-Degrees of freedom are important because they indicate the amount of independent information available to estimate parameters, which affects the reliability and precision of the estimates.
How does the concept of degrees of freedom relate to choosing mobile handsets?
-The concept is illustrated by choosing mobile handsets, where the degrees of freedom decrease as you make choices, similar to how the degrees of freedom decrease as you estimate more parameters from a dataset.
What is the example given in the script to explain degrees of freedom?
-The script uses the example of choosing a mobile handset from a set of 10 handsets. On the first day, you have 10 choices (10 degrees of freedom), and each subsequent day, your choices (degrees of freedom) decrease by one until the last day when you have no choice left.
How does the concept of degrees of freedom apply to estimating the average price of a sample of objects?
-When estimating the average price from a sample, once you know the average, the price of the last object is determined (one degree of freedom is lost), because the sum of the prices must equal the total calculated average.
What is the formula used to calculate the standard deviation of the population?
-The standard deviation of the population is calculated using the formula that involves the sum of the squared differences between each data point and the population mean, divided by the degrees of freedom (which is the number of observations minus one).
Why do we lose a degree of freedom when estimating the sample mean?
-We lose a degree of freedom when estimating the sample mean because once the mean is fixed, it constrains the sum of the data points, and thus the last data point's value is determined by the others, reducing the number of independent pieces of information.
What is the adjusted formula for calculating the sample standard deviation?
-The adjusted formula for calculating the sample standard deviation divides the sum of the squared differences between each data point and the sample mean by the degrees of freedom, which is the number of observations minus one (n-1).
Why is the concept of degrees of freedom not applicable when calculating the population standard deviation?
-The concept of degrees of freedom is not applicable when calculating the population standard deviation because the population includes all possible observations, so changes in the data do not constrain the calculation of the parameter as they do with a sample.
How are degrees of freedom used in other statistical contexts like regression parameters or chi-square tests?
-In other statistical contexts like regression analysis or chi-square tests, degrees of freedom are used to determine the number of independent pieces of information available for estimating parameters or conducting tests, which affects the validity and interpretation of the results.
What other statistical concepts are related to the concept of degrees of freedom?
-Other statistical concepts related to degrees of freedom include regression parameters estimation and tests such as kurtosis and skewness, where understanding degrees of freedom is crucial for proper analysis.
What does the script suggest to do for further understanding of kurtosis and skewness?
-The script suggests watching another video to gain more knowledge on kurtosis and skewness, indicating that these topics are complex and benefit from additional learning resources.
Outlines
📚 Understanding Degrees of Freedom in Statistics
This paragraph introduces the concept of degrees of freedom in the context of statistics. It clarifies that degrees of freedom refer to the number of values in a dataset that can independently change when estimating statistical parameters. The paragraph uses an analogy of choosing mobile handsets to illustrate how degrees of freedom decrease as choices are made, emphasizing the three key points: the number of observations, how many are free to vary, and the estimation of statistical parameters. It also discusses how knowing the average price of a set of objects limits the price of the last object to maintain that average, thus losing one degree of freedom. The concept is further explored in relation to estimating the standard deviation and the impact on the calculation when using sample mean instead of the population mean.
🔍 Degrees of Freedom in Population Standard Deviation and Other Statistical Applications
The second paragraph delves into the logic behind the loss of degrees of freedom when calculating the population standard deviation. It explains that for a population, which includes all possible objects, any change in the population requires recalculating the entire parameter, hence no loss of freedom occurs. The paragraph also touches on how degrees of freedom are considered in other statistical applications such as estimating regression parameters and using chi-square tests. It concludes by mentioning that degrees of freedom are also relevant in the study of statistical measures like kurtosis and skewness, encouraging viewers to watch another video for more information on these topics.
Mindmap
Keywords
💡Degrees of Freedom
💡Statistical Parameters
💡Estimation
💡Arithmetic Average
💡Standard Deviation
💡Population Mean (mu)
💡Sample Mean (x bar)
💡Observations
💡Kurtosis and Skewness
💡Chi-Square Tests
Highlights
Exploring the concept of degrees of freedom in statistics.
Degrees of freedom are the number of observations free to vary when estimating statistical parameters.
Three golden points to remember about degrees of freedom: number of observations, freedom to vary, and statistical parameter estimation.
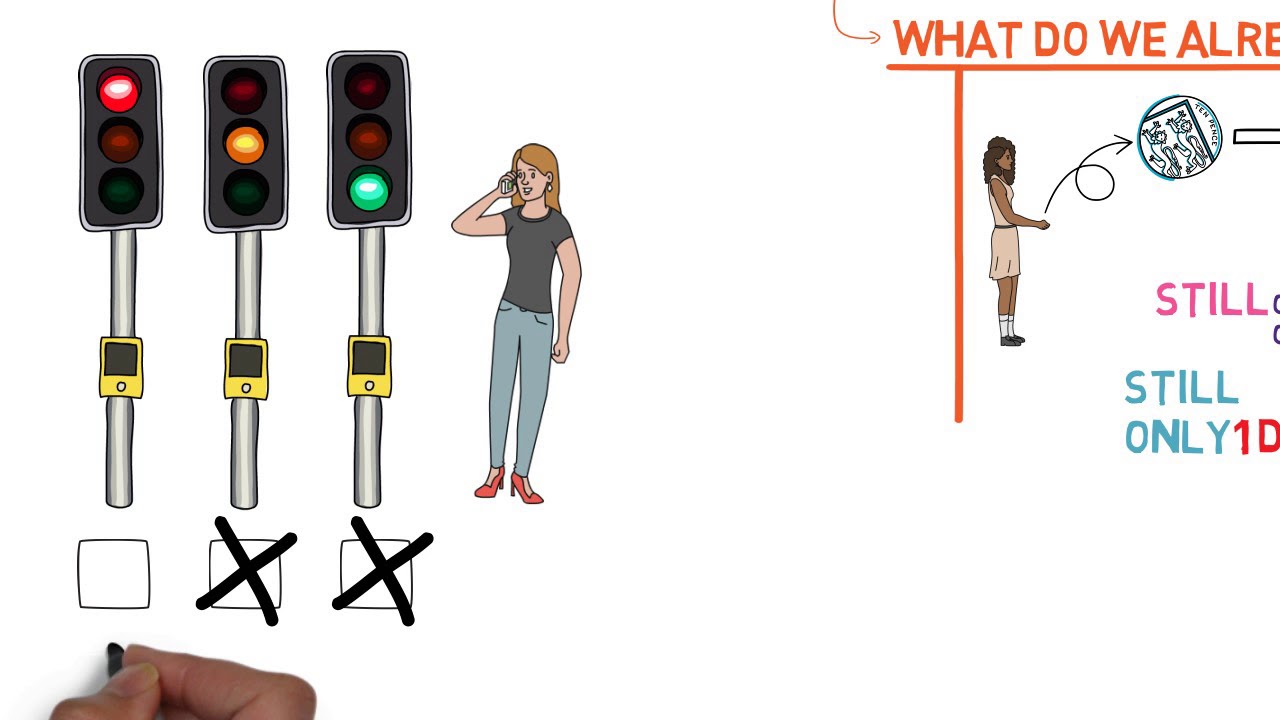
An analogy using mobile handsets to explain degrees of freedom.
Assuming ownership of 10 mobile handsets and the reduction of choices each day as an example of degrees of freedom.
On the tenth day, no choice remains except for the last handset, illustrating the concept of degrees of freedom.
Using a sample of 5 objects to estimate the arithmetic average price and the concept of estimation in statistics.
Knowing the average price of a sample set and the necessity for the last object's price to maintain that average.
Representing the sample average with x-bar and the loss of one degree of freedom in estimating it.
Calculating the standard deviation of a sample and the transformation of the equation due to the loss of one degree of freedom.
The difference in degrees of freedom when estimating the population standard deviation versus a sample standard deviation.
Population parameters are reworked with any change in the population, thus not losing any freedom.
Degrees of freedom apply similarly when estimating regression parameters or using chi-square tests.
Degrees of freedom are also used in the context of kurtosis and skewness.
Invitation to watch another video for more on kurtosis and skewness.
Closing with well-wishes for health and peace, and thanks for watching.
Transcripts
Browse More Related Video

What are degrees of freedom?!? Seriously.
What is a degree of freedom?

Degrees Of Freedom Explained | What is Degrees of freedom | Degrees of freedom in statistics
what are degrees of freedom?

What are degrees of freedom in statistics? A simple explanation.
Introduction to the t Distribution (non-technical)
5.0 / 5 (0 votes)
Thanks for rating: