Degrees Of Freedom Explained | What is Degrees of freedom | Degrees of freedom in statistics
TLDRIn this educational video, data scientist Aman simplifies the concept of degrees of freedom, a topic often misunderstood and frequently asked in interviews. He begins with a basic example involving students' marks to illustrate degrees of freedom as the number of values that can vary without violating a system's constraints. Aman then relates this concept to regression analysis, explaining how degrees of freedom impact the learning capability of a model. Using the formula n - k - 1, where n is the number of data points and k is the number of parameters, he demonstrates how increasing degrees of freedom enhances model learning. Finally, Aman provides a practical Python example using a stats model to show degrees of freedom in action, clarifying the concept for viewers.
Takeaways
- 😀 Degrees of freedom are crucial for understanding statistical models and are often asked about in interviews.
- 😀 Degrees of freedom represent how many values in a calculation are free to vary while adhering to certain constraints.
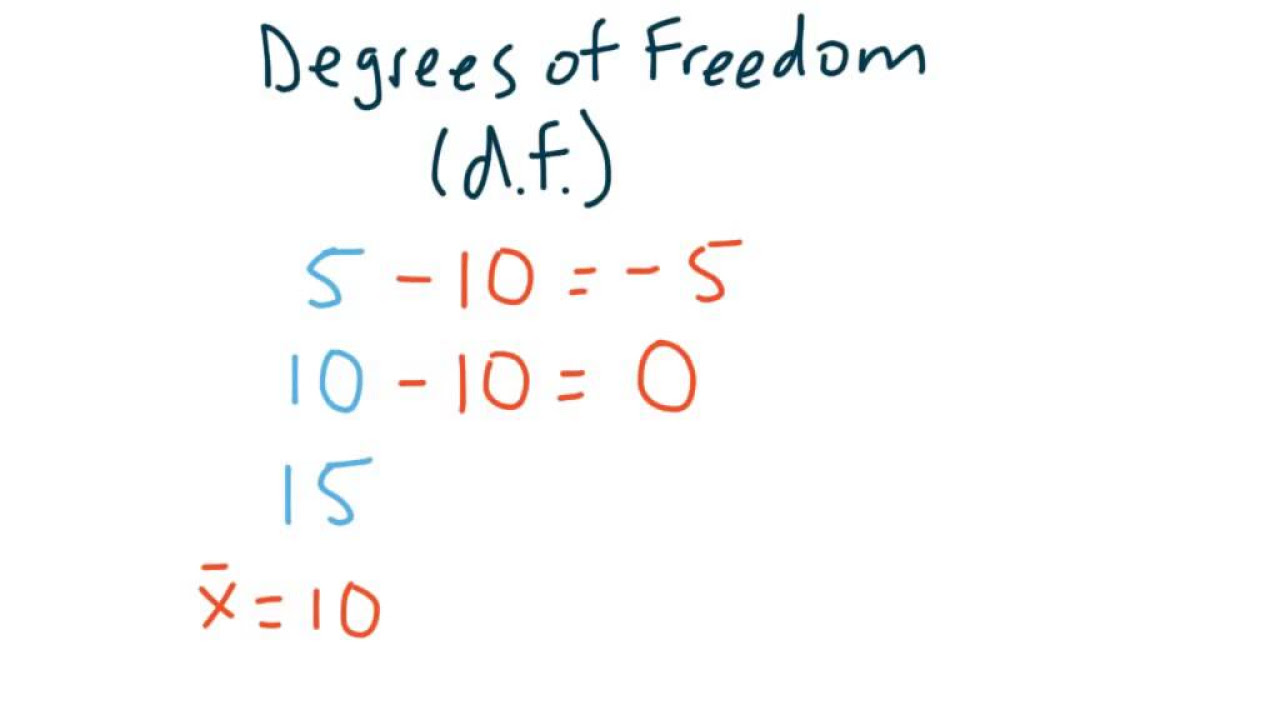
- 😀 In a simple example, if there are three students with scores of 10, 5, and 15, the average score is 10, and the degrees of freedom is 2.
- 😀 For a regression equation like y = mx + c, degrees of freedom depend on the constraints placed on the variables.
- 😀 In linear regression, the degrees of freedom help determine how well the model can learn from the data.
- 😀 The formula for calculating degrees of freedom in regression is n - k - 1, where n is the number of data points, and k is the number of independent variables.
- 😀 In a simple linear regression with one independent variable, a minimum of three data points is required to have one degree of freedom.
- 😀 For multiple linear regression with two independent variables, a minimum of four data points is required to maintain one degree of freedom.
- 😀 Degrees of freedom increase as the number of data points increases, allowing the model to learn more effectively.
- 😀 In Python, using stats models for regression can help demonstrate how degrees of freedom are applied in practical scenarios.
Q & A
What is the main topic of the video?
-The main topic of the video is explaining the concept of degrees of freedom in a simple manner, relating it to regression, and demonstrating it with a Python example.
Why is the concept of degrees of freedom important in interviews?
-The concept of degrees of freedom is important in interviews because it is a fundamental concept in statistics and data science, often used in regression analysis, and understanding it well can demonstrate a candidate's expertise.
What is the generic definition of degrees of freedom?
-The generic definition of degrees of freedom is the number of values that can vary freely while still adhering to the constraints of a system or framework.
How does the video relate degrees of freedom to a class of students and their marks?
-The video uses an example of a class with three students, each having different marks, to illustrate that the sum of the differences from the mean must be zero, thus explaining that there are only two degrees of freedom in this scenario as the third student's marks are determined by the first two.
What is the relationship between degrees of freedom and regression?
-In regression, degrees of freedom is related to the number of parameters that can be estimated without overfitting the model. It is calculated as the number of observations minus the number of parameters to be estimated minus one.
How does the video explain the degrees of freedom in the context of a simple linear regression?
-The video explains that in a simple linear regression with one independent variable (x) and one target variable (y), you need at least three data points to estimate the relationship meaningfully, which gives you one degree of freedom.
What is the formula for calculating degrees of freedom in a linear regression model?
-The formula for calculating degrees of freedom in a linear regression model is n - k - 1, where n is the number of observations and k is the number of parameters to be estimated.
How does the video demonstrate the degrees of freedom in a Python example?
-The video demonstrates the degrees of freedom in a Python example by using a dataset with 100 rows and three independent columns, showing that the degrees of freedom would be 97, which is calculated as 100 (n) minus 3 (k) minus 1.
What is the significance of having more degrees of freedom in a model?
-Having more degrees of freedom in a model allows for more learning capability, as it provides the model with more information to learn from and adapt to the data.
What is the minimum number of data points required for a meaningful relationship in a regression with two independent variables?
-For a meaningful relationship in a regression with two independent variables, you need at least four data points, as this provides one degree of freedom for the model to learn from.
Outlines
📚 Introduction to Degrees of Freedom
In this introductory paragraph, the speaker, Aman, a data scientist, welcomes the audience to a video on the concept of degrees of freedom in the context of data science. He aims to simplify the topic, which is commonly misunderstood and frequently asked about in interviews. Aman plans to explain the generic definition of degrees of freedom using a straightforward example and then relate it to regression analysis. He also promises to demonstrate the concept with a Python example. The paragraph sets the stage for a deeper dive into degrees of freedom, establishing it as a pivotal topic for those in the field.
📐 Understanding Degrees of Freedom with an Example
This paragraph delves into the concept of degrees of freedom through a classroom example involving three students, A, B, and C, with respective scores of 10, 5, and 15. Aman illustrates how the average score is calculated and how the differences from the mean must sum to zero, a fundamental principle in statistics. He uses this example to explain that the third score is not freely variable because it must balance the other two to maintain the sum at zero, thus introducing the idea of degrees of freedom as the number of values that can be varied without breaking the underlying rules of the system. The paragraph concludes with a clear definition of degrees of freedom in this context, which is two, as only the first two scores can be freely changed.
📈 Degrees of Freedom in Linear Regression
Aman extends the discussion of degrees of freedom to the realm of linear regression. He uses the equation y = mx + c to explore how many lines can be drawn without constraints, which is infinite, and then introduces constraints to demonstrate how degrees of freedom decrease as more information is given. For instance, fixing the value of c reduces the degrees of freedom to one, as lines must pass through a specific point. If both m and c are fixed, only one line can be drawn, reducing the degrees of freedom to zero. The speaker then transitions to a more complex scenario with one target variable and one independent variable, discussing the minimum number of data points required to estimate the relationship between them. He explains that with three data points, a meaningful relationship can be derived, as this provides one degree of freedom for the model to learn the pattern. The paragraph concludes with the general formula for degrees of freedom in regression, which is n - k - 1, where n is the number of data points, and k is the number of independent variables.
🔍 Further Exploration of Degrees of Freedom in Multiple Linear Regression
Building upon the previous discussion, Aman introduces a scenario with two independent features and a target variable, aiming to establish the relationship y = beta0 + beta1*x1 + beta2*x2. He asks how many minimum data points are needed to define this relationship meaningfully, using a three-dimensional plot as a visual aid. The speaker explains that in a multi-dimensional space, the minimum degrees of freedom required increases because a plane, rather than a line, is needed to represent the relationship. The formula n - k - 1 still applies, but with an adjusted value for k to account for the additional independent variable. Aman emphasizes that the number of data points (n) must be at least four to achieve a single degree of freedom when dealing with two independent variables. The paragraph reinforces the concept that more degrees of freedom allow for greater model learning capability.
🤖 Demonstrating Degrees of Freedom in Python
In the final paragraph, Aman provides a practical demonstration of degrees of freedom using a Python example with a dataset consisting of x_train, x_test, y_train, y_test, and three independent columns. He explains that with 100 rows of training data and three independent features, the degrees of freedom would be calculated as n - k - 1, which should equal 96. However, he notes that the example in Python, using a stats model OLS (Ordinary Least Squares), shows 97 degrees of freedom because the model does not include an intercept by default. If an intercept were included, the degrees of freedom would align with the formula. Aman concludes by reiterating the importance of understanding degrees of freedom as a measure of the number of freely varying parameters in a model and encourages viewers to ask questions and suggest topics for future videos.
Mindmap
Keywords
💡Degrees of Freedom
💡Data Scientist
💡Regression
💡Average
💡Linear Regression
💡Beta Coefficients
💡Constraints
💡Ordinary Least Squares (OLS)
💡Intercept
💡Learning Capability
Highlights
Introduction to the concept of degrees of freedom in statistics and its importance in data science.
Explanation of degrees of freedom using a simple classroom example with three students and their marks.
Illustration of how the sum of differences from the mean must equal zero, establishing the concept of constraints.
The example clarifies that in the given scenario, the degrees of freedom are two, as only two marks can be varied while maintaining the sum to zero.
Transition to the application of degrees of freedom in the context of regression analysis.
Demonstration of how degrees of freedom affect the number of lines that can be drawn from the equation y = mx + c.
Explanation of how fixing certain variables in a regression equation reduces the degrees of freedom.
Introduction of the formula for degrees of freedom in regression: n - k - 1, where n is the number of data points and k is the number of parameters.
Example of determining the minimum number of data points needed to estimate a relationship with one independent variable.
Discussion on the necessity of three data points to derive a meaningful relationship between y and x in a simple linear regression.
Introduction of a scenario with two independent features and the corresponding increase in the minimum number of data points required.
Explanation of how the degrees of freedom increase with more independent variables, enhancing the model's learning capability.
Python example demonstrating how degrees of freedom are calculated in a simple linear regression model using a Jupiter notebook.
Clarification of the discrepancy between the expected and observed degrees of freedom due to the model's default settings not including an intercept.
Final summary emphasizing the importance of degrees of freedom in determining the model's learning capacity and the basic definition of the concept.
Invitation for viewers to ask questions and suggest topics for future videos, emphasizing the goal of making complex concepts simple.
Transcripts
Browse More Related Video

What is Degrees Of Freedom in Statistics? Degrees of freedom in Statistics Explained!
What are Degrees of Freedom?

What is a degree of freedom?

What are degrees of freedom in statistics? A simple explanation.

What are degrees of freedom?!? Seriously.
Regression II - Degrees of Freedom EXPLAINED | Adjusted R-Squared
5.0 / 5 (0 votes)
Thanks for rating: