2022 AP Calculus AB & AP Calculus BC Exam FRQ #1
TLDRThis video script outlines a comprehensive approach to solving a calculus problem from the 2022 Calc AB exam. The problem involves determining the total number of vehicles that arrive at a toll plaza between 6am and 10am, given a rate function a(t) = 450√sin(0.62t). The video guides viewers through setting up the integral expression for part A without evaluation, and then moves on to part B, where it calculates the average rate of vehicle arrival over the interval from t=1 to t=5. The average rate is found to be 375.537 vehicles per hour. The script also addresses whether the rate is increasing or decreasing at t=1 by evaluating the derivative of the rate function. Furthermore, it explores when a line forms at the toll plaza, given that the rate a(t) exceeds 400 vehicles per hour, and uses the candidate's test to find the greatest number of vehicles in line between t=1.46937 and t=4, concluding with 71 vehicles as the maximum. The video serves as an educational resource for understanding calculus concepts and problem-solving techniques.
Takeaways
- 📚 The video discusses a calculus problem from the 2022 exam, focusing on rate of change and integral calculus.
- ⏰ The problem involves calculating the total number of vehicles arriving at a toll plaza between 6am and 10am, given a rate function a(t).
- 📈 The rate function a(t) is defined as 450 * sqrt(sin(0.62t)), where t is the number of hours after 5am.
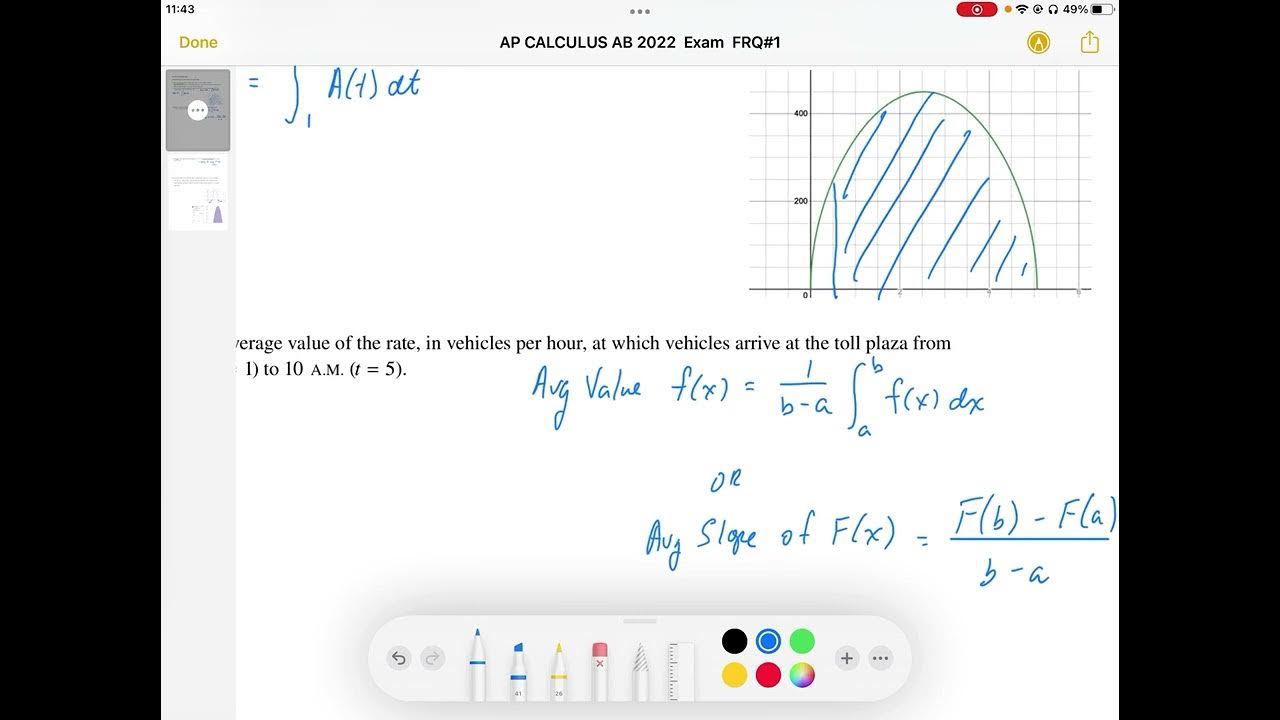
- 🔍 Part A of the problem asks for the integral expression for the total vehicles without evaluating it, which is ∫ from 1 to 5 of a(t) dt.
- 🧮 Part B requires finding the average rate of vehicles per hour over the interval from t=1 to t=5, using the integral of a(t) divided by the interval length.
- 📊 The average rate is calculated as ∫ from 1 to 5 of a(t) dt divided by 4, resulting in approximately 375.537 vehicles per hour.
- 🔺 To determine if the rate is increasing or decreasing at t=1, the derivative a'(t) is evaluated, which comes out to be greater than 0, indicating an increase.
- 🚦 The problem also explores when a line forms at the toll plaza, which happens when the rate a(t) is greater than or equal to 400 vehicles per hour.
- 📉 The number of vehicles in line at time t is given by the integral from a to t of a(x) - 400 dx, where a is the time the line first begins to form.
- 🏁 Using the candidate's test, the maximum number of vehicles in line on the interval from a to 4 is found to be 71 vehicles.
- 📝 The video emphasizes the importance of understanding the problem and setting up the integral expressions correctly before attempting to solve them.
Q & A
What is the rate at which vehicles arrive at the toll plaza from 5 am to 10 am?
-The rate at which vehicles arrive at the toll plaza is given by the function a(t) = 450√sin(0.62t), where t is the number of hours after 5 am and a(t) is measured in vehicles per hour.
What is the integral expression that represents the total number of vehicles that arrive at the toll plaza between t=1 and t=5?
-The integral expression is the integral from 1 to 5 of a(t) dt, which represents the total number of vehicles arriving at the toll plaza during that time interval.
How do you find the average value of the rate at which vehicles arrive at the toll plaza from t=1 to t=5?
-The average value is found by dividing the integral of a(t) from 1 to 5 by the interval length, which is 5 - 1. The expression is (∫ from 1 to 5 of a(t) dt) / 4.
What does it mean for the rate a(t) to be increasing or decreasing at t=1?
-To determine if the rate is increasing or decreasing, one must find the derivative a'(t) and evaluate it at t=1. If a'(1) > 0, the rate is increasing; if a'(1) < 0, it is decreasing.
What is the value of a'(1), the derivative of the rate function at t=1?
-The value of a'(1) is approximately 148.947, indicating that the rate at which vehicles arrive at the toll plaza is increasing at t=1 (6 am).
When does a line begin to form at the toll plaza?
-A line begins to form whenever the rate a(t) is greater than or equal to 400 vehicles per hour.
How is the number of vehicles in line at time t calculated for t when a(t) is less than or equal to 400?
-The number of vehicles in line at time t is given by the integral from a to t of a(x) - 400 dx, where a is the time when the line first begins to form.
What is the greatest number of vehicles in line at the toll plaza in the time interval from a to 4?
-The greatest number of vehicles in line is 71, found by evaluating the function n(t) at the endpoints and critical points within the interval and then determining the absolute maximum.
What test was used to find the absolute maximum number of vehicles in line?
-The Candidate's Test (also known as the Extreme Value Theorem) was used to find the absolute maximum, which states that the maximum is either at an endpoint or at a critical point of the interval.
At what time does the rate a(t) first equal 400 vehicles per hour?
-The rate a(t) first equals 400 vehicles per hour at approximately t = 1.46937 hours after 5 am.
What is the significance of the function a(t) being stored in a calculator for solving the problem?
-Storing the function a(t) in a calculator allows for easier manipulation and evaluation of the function, its integral, and its derivative throughout the problem-solving process.
Why is it important to consider the units of the function when calculating the average value of a(t)?
-Considering the units ensures that the result is meaningful and relevant to the problem context. Since a(t) is in vehicles per hour, the average value should also be in the same units to represent the average rate of vehicle arrival.
Outlines
📈 Calculating Vehicle Arrivals at a Toll Plaza
This paragraph introduces a calculus problem from the 2022 exam, focusing on the rate of change of vehicles arriving at a toll plaza. The rate is given by a function a(t) = 450√(sine(0.62t)), where t is the number of hours after 5 am. The task is to write an integral expression for the total number of vehicles that arrive between t=1 and t=5 without evaluating it. The paragraph also covers finding the average value of the rate over the interval from t=1 to t=5, which involves integrating a(t) and dividing by the interval length. The average value is determined to be 375.537 vehicles per hour. Additionally, the paragraph discusses the rate of change at t=1, finding that it is increasing by evaluating the derivative a'(t) at t=1, which is approximately 148.947.
🚦 Analyzing Vehicle Queue at the Toll Plaza
The second paragraph continues the toll plaza problem by addressing when a line forms, which is when the rate a(t) is greater than or equal to 400 vehicles per hour. The task is to find the greatest number of vehicles in line during the time interval from t=a to t=4, where a is the time when the line first begins to form. To solve this, the presenter uses a candidate's test to find the absolute maximum of the function n(t), which represents the number of vehicles in line at time t. The function n(t) is defined as the integral from a to t of (a(x) - 400) dx. The presenter identifies critical points where the derivative of n(t) is zero and evaluates the function at these points as well as at the endpoints of the interval. After calculating the values, a table of values is created to determine the maximum number of vehicles in line, which is found to be 71 at t=3.59771, within the given time interval.
Mindmap
Keywords
💡Rate of Change
💡Integral Expression
💡Average Value
💡Derivative
💡Critical Point
💡Cauchy's Mean Value Theorem
💡Toll Plaza
💡Vehicles Per Hour
💡Root Sine Function
💡Candidate's Test
💡Continuous Function
Highlights
The video discusses a rate of change problem from the 2022 calculus exam.
The rate at which vehicles arrive at a toll plaza is given by a function a(t) = 450√sin(0.62t), where t is the number of hours after 5 am.
Part A of the problem asks to write, but not evaluate, an integral expression for the total number of vehicles arriving between t=1 and t=5.
Part B requires finding the average value of the rate at which vehicles arrive between t=1 and t=5.
The average value is calculated as the integral of a(t) from 1 to 5 divided by the interval (5-1).
The integral of a(t) from 1 to 5 is calculated to be approximately 375.537 vehicles per hour.
The rate at which vehicles arrive at the toll plaza at t=1 is found to be increasing by evaluating the derivative of a(t) at t=1.
The derivative a'(t) at t=1 is approximately 148.947, indicating an increasing rate.
A line forms at the toll plaza when the rate a(t) is greater than or equal to 400 vehicles per hour.
The number of vehicles in line at time t is given by the integral from a to t of a(x) - 400 dx, where a is the time the line first forms.
The greatest number of vehicles in line is found using the candidate's test on the closed interval from a to 4.
The first time the rate a(t) equals 400 is at approximately t=1.46937 hours after 5 am.
The candidate's test is applied to find the absolute maximum of the function n(t) on the interval.
Critical points for n(t) are found by setting the derivative n'(t) equal to zero.
The maximum number of vehicles in line is determined to be 71 at t=4, using a table of values for n(t).
The candidate's test is confirmed as a method to find the absolute maximum on a closed interval.
The solution process involves understanding the problem, setting up integral expressions, and using calculus concepts like derivatives and the candidate's test.
Transcripts
Browse More Related Video


5.0 / 5 (0 votes)
Thanks for rating: