2022 AP Calculus AB BC Free Response #1
TLDRThe video script discusses a calculus problem involving the rate at which vehicles arrive at a toll plaza between 6 a.m. and 10 a.m. The presenter begins by outlining the problem, which involves calculating the total number of vehicles that arrive within a certain time frame using an integral expression. They then proceed to find the average value of the rate at which vehicles arrive, explaining the concept of average value in the context of calculus. The presenter also explores whether the rate of vehicle arrival is increasing or decreasing by examining the derivative of the rate function. Subsequently, the script delves into finding the greatest number of vehicles in line at the toll plaza during a specific time interval, which requires determining when a queue first begins to form and calculating the number of vehicles in line at various points in time. The presenter uses a combination of calculus techniques, including integrals and derivatives, to solve the problem, and emphasizes the importance of understanding the problem's context and the mathematical concepts involved.
Takeaways
- 📈 The rate at which vehicles arrive at a toll plaza from 6 a.m. to 10 a.m. is given by the function 450√(sin(0.62t)), where t is the number of hours after 5 a.m.
- 🧮 To find the total number of vehicles that arrive at the toll plaza during a specific time frame, one must integrate the rate function over that interval.
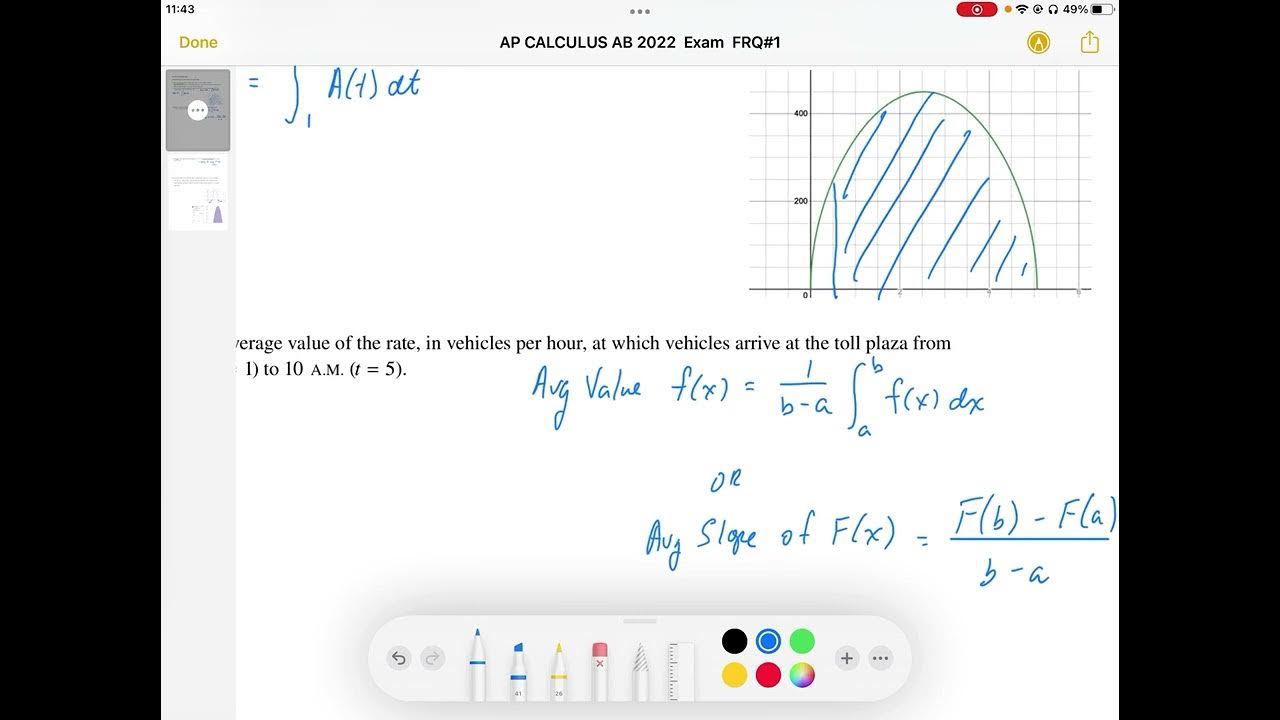
- 🔢 The average value of the rate is calculated by dividing the integral of the rate function over the interval by the width of the interval.
- ⛔ The line at the toll plaza begins to form when the rate of vehicle arrival (a(t)) is greater than or equal to 400 vehicles per hour.
- 📌 The greatest number of vehicles in line is found by evaluating the function at critical points and endpoints within the given time frame.
- 💡 The derivative of the rate function (a'(t)) is used to determine whether the rate is increasing or decreasing at a particular time t.
- 📉 The number of vehicles in line at time t is represented by the function n(t), which is the integral from 'a' to 't' of (a(x) - 400) dx, where 'a' is when the line begins to form.
- 🔍 To find the time 'a' when the line begins to form, one must solve for when the rate of vehicle arrival equals 400 vehicles per hour.
- 📐 Utilizing a graph to visualize the rate function and the line y=400 can help in finding the critical points and the time 'a'.
- 🔢 The final answer for the greatest number of vehicles in line is obtained by evaluating the function n(t) at the critical points and choosing the maximum value.
- 🤔 The process involves understanding the rate of change, integration, average value, and critical points to solve the problem accurately.
Q & A
What is the given rate at which vehicles arrive at the toll plaza?
-The rate at which vehicles arrive at the toll plaza is given by the function 450√(sin(0.62t)), where t is the number of hours after 5 a.m. and the rate is measured in vehicles per hour.
What is the integral expression that gives the total number of vehicles that arrive at the toll plaza from 6 a.m. to 10 a.m.?
-The integral expression is the integral from 1 to 5 of the rate function, which is ∫(450√(sin(0.62t))) dt.
How do you find the average value of the rate at which vehicles arrive at the toll plaza from 6 a.m. to 10 a.m.?
-To find the average value, you would divide the integral of the rate function over the interval from 1 to 5 by the width of the interval, which is 4 hours in this case.
What is the result of the average rate of vehicles arriving at the toll plaza from 6 a.m. to 10 a.m.?
-The average rate is calculated to be 537.5 vehicles per hour.
How do you determine if the rate at which vehicles arrive is increasing or decreasing?
-To determine if the rate is increasing or decreasing, you would compute the derivative of the rate function and check if it is positive or negative. A positive derivative indicates an increasing rate.
At what time does the rate of vehicles arriving first become greater than or equal to 400 vehicles per hour?
-The rate first becomes greater than or equal to 400 vehicles per hour at t = 1.4694 hours after 5 a.m.
What is the equation for the number of vehicles in line at time t for t between a and 4?
-The number of vehicles in line at time t for t between a and 4 is given by the equation involving the integral of the rate function minus 400 from the start time 'a' to time 't'.
How do you find the greatest number of vehicles in line at the toll plaza in the time interval from a to 4?
-To find the greatest number of vehicles in line, you would perform a candidates test by checking the critical points where the derivative of the number of vehicles in line is zero and evaluating the function at the endpoints and critical points.
What is the final answer for the greatest number of vehicles in line at the toll plaza in the time interval from a to 4?
-The final answer for the greatest number of vehicles in line is 71 vehicles.
What is the significance of the value 'a' in the context of the toll plaza scenario?
-'a' represents the time at which the line at the toll plaza first begins to form, which is crucial for determining when the rate of vehicles arriving first exceeds 400 per hour.
How does one find the value of 'a' when the rate of vehicles arriving equals 400?
-To find the value of 'a', you would set the rate function equal to 400 and solve for 't'. The solution would give you the time when the rate of vehicles arriving first reaches 400 vehicles per hour.
What is the method used to ensure that the mistakes are minimized while solving the problem?
-The method involves carefully analyzing the given information, using calculus to find derivatives and integrals, and double-checking calculations, possibly with a calculator in radian mode, to ensure accuracy.
Outlines
📚 Calculating the Average Vehicle Arrival Rate
The first paragraph discusses a problem related to the rate at which vehicles arrive at a toll plaza. The speaker begins by mentioning the release of AP free response questions and then focuses on a specific problem involving the calculation of the total number of vehicles that arrive from 6 a.m. to 10 a.m. The rate of arrival is given as a function of time, and the speaker emphasizes the importance of understanding the concept of the rate. The problem involves integrating the rate function from 1 to 5 hours after 5 a.m. to find the total number of vehicles. The speaker also calculates the average value of the rate by dividing the integral by the interval width and uses units to check the result. Finally, the speaker explores whether the rate is increasing or decreasing by computing the derivative of the rate function.
🚦 Determining the Formation of Vehicle Lines
The second paragraph deals with the formation of lines at the toll plaza when the arrival rate exceeds 400 vehicles per hour. The speaker seeks to find the greatest number of vehicles in line during the interval from a certain time 'a' to 4 a.m. The speaker uses calculus to find critical points where the derivative of the rate function equals 400, indicating when the line begins to form. The speaker uses a graphing calculator to find the first intersection point and the second intersection point, which are critical points. The speaker also discusses the need to evaluate the endpoints and the importance of understanding when the line begins to form. The paragraph concludes with the speaker expressing some confusion and the need to clarify certain aspects of the problem.
🔍 Analyzing the Maximum Number of Vehicles in Line
The third paragraph continues the discussion on the toll plaza problem, focusing on when the rate of vehicle arrival exceeds 400 and how to determine the maximum number of vehicles in line. The speaker uses a graphical approach to identify when the rate function intersects with the constant rate of 400 vehicles per hour. The speaker identifies two critical points where this intersection occurs and calculates the number of vehicles in line at these points. The speaker also evaluates the endpoints of the interval and discusses the need to find the time 'a' when the rate first reaches 400 vehicles per hour. The paragraph concludes with the speaker providing a final answer to the problem and reflecting on the complexity of the task, particularly the need to first determine the critical point 'a'.
Mindmap
Keywords
💡Free Response Questions
💡Integral Expression
💡Average Value
💡Derivative
💡Critical Points
💡Toll Plaza
💡Vehicles in Line
💡Radian Mode
💡Intersection Point
💡Absolute Max
💡Candidates Test
Highlights
The rate at which vehicles arrive at the toll plaza from 6 a.m to 10 a.m is given by the function 450 * sqrt(sin(0.62 * t)), where t is the number of hours after 5 a.m.
The total number of vehicles that arrive from 6 a.m to 10 a.m is found by integrating the rate function from t=1 to t=5.
The average value of the rate is computed by dividing the integral of the rate function over the interval by the interval width (4 hours).
The average rate of vehicles arriving per hour from 6 a.m to 10 a.m is 537 vehicles per hour.
The rate is increasing at t=1 since the derivative of the rate function at t=1 is positive.
A line begins to form at the toll plaza when the rate of vehicles arriving (a(t)) is greater than or equal to 400 vehicles per hour.
To find when the line first forms, we need to determine when the rate a(t) is equal to 400 and then set up a candidates test to find the maximum number of vehicles in line.
The derivative of the rate function a'(t) is used to find when a(t) = 400 by setting a'(t) = 400 and solving for t.
The two critical points where a'(t) = 0 are found to be t = 1.4694 and t = 3.5977. Endpoints at t=a and t=4 are also evaluated.
The value of 'a', the time when the line first forms, is determined to be when a(t) = 400. This occurs at t = 1.4694 hours after 5 a.m.
The number of vehicles in line at time t is given by the integral of (a(t) - 400) from the time 'a' when the line first forms to time t.
The maximum number of vehicles in line from t=a to t=4 is found by evaluating the integral at the critical points and endpoints, and rounding to the nearest whole number.
The greatest number of vehicles in line during the interval is found to be 71 vehicles at t = 3.5977 hours after 5 a.m.
The problem involves finding the rate of vehicles arriving, average rate, when the line forms, and the maximum number of vehicles in line using calculus concepts.
Integration is used to find the total number of vehicles arriving over an interval and the number of vehicles in line at a given time.
Derivatives are used to determine when the rate of vehicles arriving is increasing and when it first reaches a certain threshold.
Critical points and endpoints are evaluated to find the maximum number of vehicles in line during the interval using the candidates test.
The problem requires a solid understanding of calculus concepts and techniques, including integration, derivatives, and critical point analysis.
Clear explanations and step-by-step solutions are provided to guide students through the problem-solving process.
Transcripts
Browse More Related Video


5.0 / 5 (0 votes)
Thanks for rating: