AP CALCULUS AB 2022 Exam Full Solution FRQ#1d
TLDRThe video script discusses the formation of a line at a toll plaza and the maximum capacity of vehicles it can handle per hour. It is established that 400 cars per hour is the maximum rate, and when the rate exceeds this, a line forms. The script describes a method to determine when the line begins to form by graphing the function 'a of x minus 400', which reveals that the line starts forming at 1.469 hours. The line continues to accumulate until 3.598 hours, after which the rate drops below 400 and the line begins to diminish. To find the maximum number of vehicles in line at the toll plaza, the area above the curve of 'a of x minus 400' between 1.469 and 3.598 hours is calculated. The integral of this function within these bounds yields an area representing the maximum number of cars, which is approximately 71.25, rounded to the nearest whole number, 71 cars.
Takeaways
- 🚦 The toll plaza has a maximum capacity of 400 cars per hour, beyond which a line begins to form.
- 📈 The graph of 'a of x minus 400' helps determine when the number of cars exceeds the toll plaza's capacity.
- ⏱️ The line begins to form at approximately 1.469 hours, as calculated from the graph.
- 🚗 The line continues to accumulate from 1.469 hours until 3.598 hours, indicating a period of congestion.
- 📊 After 3.598 hours, the rate 'a' drops below 400, suggesting the line will start to diminish as cars are processed.
- 🔍 The area above the curve of 'a of x minus 400' represents the total number of backed-up cars.
- 📉 The maximum number of cars in line occurs between 1.469 and 3.598 hours when the rate exceeds capacity.
- ✅ The integral of 'a of x minus 400' from 1.469 to 3.598 hours yields an area of 72 or 71.25 cars.
- 🔢 The greatest number of cars in line at the toll plaza, rounded to the nearest whole number, is 71 cars.
- 📝 The justification is based on the condition that 'a of x minus 400' is greater than zero, indicating cars are lining up.
- 🚧 The time intervals considered for the maximum number of cars in line are from 1.469 to 4 hours.
Q & A
What does the number 400 represent in the context of the toll plaza?
-The number 400 represents the maximum rate or capacity of the toll plaza in terms of the number of cars that can be processed per hour.
What happens when the rate of cars (a of T) exceeds 400 cars per hour?
-When the rate of cars exceeds 400 cars per hour, a line begins to form at the toll plaza as the number of cars arriving is greater than the toll plaza's capacity to process them.
What is the time at which the line begins to form (a of X)?
-The line begins to form at approximately 1.469 hours, which is when the rate of cars (a of X) first exceeds the toll plaza's capacity of 400 cars per hour.
What is the time interval during which the line continues to accumulate?
-The line continues to accumulate from 1.469 hours to 3.598 hours, during which the rate of cars (a of X) remains above 400 cars per hour.
What happens after 3.598 hours?
-After 3.598 hours, the rate of cars (a of X) drops below 400 cars per hour, allowing the toll plaza to process all cars and the line to diminish.
How is the number of vehicles in the line for time T greater than T calculated?
-The number of vehicles in the line for time T greater than T is calculated by integrating the function n of T from a to T, where a is the time at which the line begins to form.
What does the integral of a of X minus 400 represent?
-The integral of a of X minus 400 represents the total number of cars that have backed up at the toll plaza during the time interval when the rate of cars exceeds the toll plaza's capacity.
What is the maximum number of cars that can be backed up at the toll plaza?
-The maximum number of cars that can be backed up at the toll plaza is approximately 71.25, which is obtained by integrating the function from 1.469 hours to 3.598 hours and rounding to the nearest whole number.
Why is the area above the curve significant in this context?
-The area above the curve is significant because it represents the total number of cars that have accumulated in the line at the toll plaza during the period when the rate of cars exceeds the toll plaza's capacity.
What is the justification for choosing 71 as the greatest number of cars in the line?
-The justification for choosing 71 as the greatest number of cars in the line is based on the integration of the function from 1.469 hours to 3.598 hours, which yields an area of 71.25 cars, and rounding this value to the nearest whole number.
How does the toll plaza manage to reduce the line after 3.598 hours?
-After 3.598 hours, the toll plaza is able to reduce the line because the rate of cars (a of X) falls below 400 cars per hour, allowing the toll plaza to process cars at a rate that matches or exceeds the arrival rate.
What is the significance of the time interval between 1.469 hours and 3.598 hours?
-The time interval between 1.469 hours and 3.598 hours is significant because it is the period during which the most number of cars are backing up at the toll plaza due to the rate of cars exceeding the toll plaza's capacity.
Outlines
🚦 Understanding Toll Plaza Capacity and Line Formation
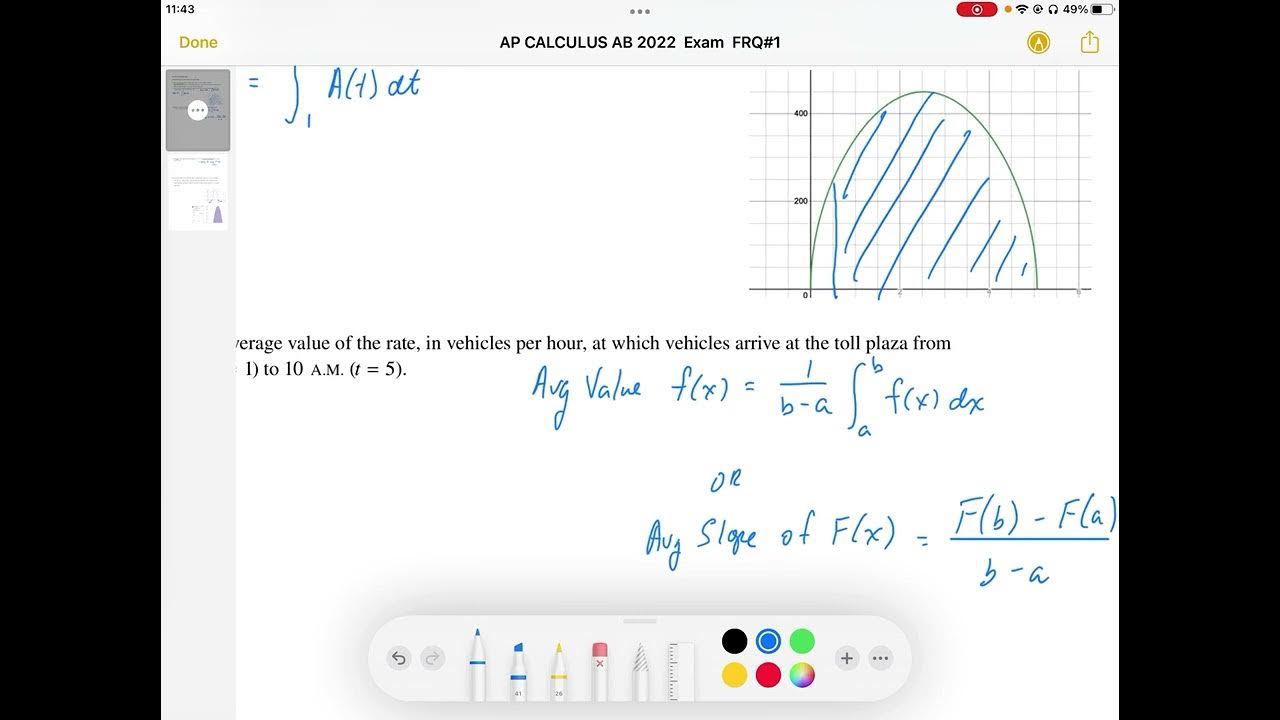
The first paragraph explains the dynamics of a toll plaza's operation. It states that a line forms when the arrival rate 'a of T' exceeds 400 cars per hour, which is the maximum capacity. The speaker has graphed 'avex minus 400' to determine when the arrival rate equals 400, finding it to be at 1.469 hours. The time when the line continues to accumulate, or 'a is above 400', is from 1.469 to 3.598 hours. After 3.598 hours, the arrival rate drops below 400, and the line starts to diminish. The task is to find the greatest number of vehicles in line at the toll plaza during the time intervals. The justification is based on the condition that cars line up when 'a of x minus 400' is greater than zero, which occurs between 1.469 and 3.598 hours. By integrating the function 'avex minus 400' over these bounds, the area representing the maximum number of cars backed up is calculated to be 71.25, which is rounded to 71 cars as the nearest whole number.
Mindmap
Keywords
💡Toll Plaza
💡Rate (a of T)
💡Capacity
💡Accumulating
💡Time Interval
💡Integration
💡Queue
💡Back Up
💡
💡Graph
💡Area Above the Curve
💡Maximum Number of Cars
💡Time 'a'
💡Time 'T'
Highlights
The toll plaza has a maximum capacity of 400 cars per hour.
A line begins to form when the rate of cars exceeds 400 per hour.
The time 'a' at which the line begins to form is crucial to understanding the backlog.
Graphical analysis is used to determine when 'a of X' passes 400.
The time 'a' is found to be 4.1.469 hours when the line begins.
The line continues to accumulate from 1.6469 hours to 3.598 hours.
After 3.598 hours, the rate 'a' drops below 400, reducing the backlog.
The integral of 'a of x minus 400' from 1.6469 to 3.598 hours represents the total backlog.
The area above the curve signifies the maximum number of cars backed up.
The integral calculation results in 72 or 71.25 cars as the maximum number in the line.
The greatest number of cars in the line at toll plaza is approximately 71, rounded to the nearest whole number.
The justification for the maximum number of cars is based on the condition 'a of x minus 400' being greater than zero.
The time interval for the maximum line-up is between 1.469 and 3.598 hours.
The process of line formation and dissipation is analyzed using mathematical integration.
The study provides a practical application of mathematical modeling to real-world traffic management.
The methodology can be applied to optimize toll plaza operations and reduce congestion.
The analysis assumes a continuous flow of cars and does not account for external variables.
The model could be refined with more data on traffic patterns and car arrival rates.
Transcripts
Browse More Related Video


5.0 / 5 (0 votes)
Thanks for rating: