Null and Alternate Hypothesis - Statistical Hypothesis Testing - Statistics Course
TLDRThis instructional transcript focuses on the foundational aspects of hypothesis testing in statistics. It emphasizes the importance of formulating the null hypothesis (H0) and the alternative hypothesis (H1) before delving into more complex problems. The speaker illustrates how to extract relevant information from real-world scenarios to construct these hypotheses. The transcript covers three distinct examples involving a soda straw manufacturing machine, average sleep duration in teens, and the percentage of students bringing phones to school. In each case, the speaker explains how to set up the hypotheses based on the problem's wording, ensuring they are mathematical opposites that cover all possible outcomes. The transcript also touches on the concepts of confidence level (C) and significance level (alpha), highlighting their interrelation and how they dictate the hypothesis testing process. The speaker stresses the need to understand the direction of the alternative hypothesis as it influences the testing method. This summary serves as a prelude to more detailed hypothesis testing procedures, aiming to equip learners with the skills to confidently approach statistical analysis.
Takeaways
- 📚 **Understanding Hypotheses**: The first step in hypothesis testing is to clearly define the null hypothesis (H0) and the alternative hypothesis (H1).
- 🧐 **Identifying Information**: Carefully read the problem to extract the necessary information to formulate the hypotheses.
- 🔄 **Mathematical Opposites**: The null and alternative hypotheses should be mutually exclusive and together cover all possible outcomes.
- 📉 **Null Hypothesis (H0)**: Represents the default or status quo belief, often indicating that there is no significant difference or effect.
- 📈 **Alternative Hypothesis (H1)**: Represents the belief that contradicts the null hypothesis, suggesting a significant difference or effect.
- ⚖️ **Hypothesis Equality**: If the problem states 'no longer than' or 'at least,' the hypotheses will be set up with 'less than or equal to' or 'greater than or equal to' respectively.
- 🔢 **Confidence and Significance**: The level of confidence (C) and the level of significance (alpha) are directly related, with C being 1 minus alpha.
- 🔣 **Sample Size and Alpha**: The number of samples and the level of significance are crucial for performing the hypothesis test.
- 📊 **Direction of Hypothesis**: The direction of the alternative hypothesis (greater than, less than, not equal to) will determine the method of hypothesis testing.
- 📐 **Proportions and Means**: Hypothesis tests can be applied to both proportions (like percentages) and means (like averages).
- 🔑 **Key to Testing**: Understanding the symbols and directions in the hypotheses is essential for knowing how to perform the correct hypothesis test.
- ➡️ **Next Steps**: After establishing the hypotheses, the next section will cover how to perform the actual hypothesis test using sample data.
Q & A
What is the primary focus of the lesson in the transcript?
-The primary focus of the lesson is to practice writing the null hypothesis and the alternative hypothesis before moving on to more complex problems in hypothesis testing.
Why is it important to write down the null and alternative hypotheses before performing a hypothesis test?
-Writing down the null and alternative hypotheses is crucial because it establishes the default belief and the claim being tested, which forms the basis for all subsequent steps in hypothesis testing.
What does the null hypothesis represent in the context of the soda straw manufacturing machine problem?
-In the context of the soda straw manufacturing machine problem, the null hypothesis represents the company's belief that the machine makes straws with an average diameter of 4 millimeters.
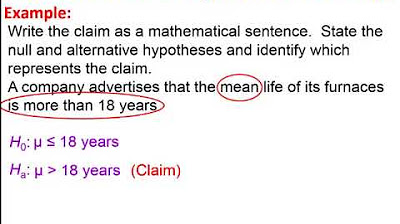
How does the wording of the problem statement influence the formulation of the null and alternative hypotheses?
-The wording of the problem statement directly influences the formulation of the null and alternative hypotheses by indicating the nature of the claim (e.g., 'no longer than,' 'at least,' 'greater than') and the direction of the alternative hypothesis (e.g., 'not equal to,' 'less than,' 'greater than').
What is the significance of the mathematical opposition between the null and alternative hypotheses?
-The mathematical opposition between the null and alternative hypotheses ensures that all possible outcomes are covered by one of the hypotheses, with no overlap, which is essential for making a clear decision about the validity of the null hypothesis.
What is the role of the confidence level in hypothesis testing?
-The confidence level, denoted by C, indicates the probability of the null hypothesis being true. It is used to determine the critical value for the test statistic, which in turn helps decide whether to reject or fail to reject the null hypothesis.
How is the level of significance (alpha) related to the confidence level (C) in hypothesis testing?
-The level of significance (alpha) is related to the confidence level (C) by being its complement. If the confidence level is high, the level of significance is low, and vice versa. Together, they add up to 1, representing the total probability space.
What does the term 'status quo' refer to in the context of the null hypothesis?
-In the context of the null hypothesis, 'status quo' refers to the current belief or accepted state of affairs that is being tested. It represents the default position that is assumed to be true until evidence suggests otherwise.
Why is it necessary to know the number of samples used in a hypothesis test?
-Knowing the number of samples used in a hypothesis test is necessary because it affects the calculation of the test statistic and the determination of statistical significance, which are key components in deciding whether to reject or fail to reject the null hypothesis.
What is the difference between a one-tailed and a two-tailed hypothesis test?
-A one-tailed hypothesis test is used when the alternative hypothesis predicts a change in one direction (either greater than or less than), while a two-tailed test is used when the alternative hypothesis predicts a change in either direction. The choice between one-tailed and two-tailed tests depends on the direction indicated by the problem statement.
How does the direction of the inequality in the alternative hypothesis affect the hypothesis test performed?
-The direction of the inequality in the alternative hypothesis determines which type of hypothesis test (one-tailed or two-tailed) will be performed. This, in turn, affects the calculation of the critical value and the decision rule for rejecting or failing to reject the null hypothesis.
Outlines
📚 Introduction to Hypothesis Testing
This paragraph introduces the concept of hypothesis testing in statistics, emphasizing the importance of first practicing how to formulate the null hypothesis and the alternative hypothesis. It uses the example of a soda straw manufacturing machine to illustrate how to extract information from a problem and translate it into these two hypotheses. The null hypothesis represents the status quo or the default belief, while the alternative hypothesis represents the new claim or challenge to the null hypothesis. The speaker also discusses the mathematical opposition between the two, ensuring they cover all possible outcomes.
💤 Hypothesis Testing with Sleep Duration
The second paragraph delves into another example, this time focusing on the average sleep duration of teenagers. It explains how the wording of the problem dictates the formulation of the null and alternative hypotheses. The null hypothesis states that the average sleep duration is no longer than 10 hours, while the alternative hypothesis posits that it is greater than 10 hours. The speaker highlights the necessity of understanding the problem's wording to correctly set up the hypotheses and the importance of the hypotheses being mutually exclusive and exhaustive of all possibilities.
📱 Hypothesis Testing with Student Phone Usage
The final paragraph discusses a scenario where a school board's claim about the percentage of students bringing phones to school is challenged by a teacher. The null hypothesis is that at least 60% of students bring phones to school, while the alternative hypothesis is that less than 60% do. The speaker explains the relationship between the level of significance (alpha) and the level of confidence (C), noting that they must sum to 1. The paragraph also touches on the practical aspect of conducting a hypothesis test using sample data and the importance of determining the threshold for rejecting the null hypothesis based on the sample results.
Mindmap
Keywords
💡Hypothesis Testing
💡Null Hypothesis (H0)
💡Alternative Hypothesis (H1 or Ha)
💡Confidence Level
💡Significance Level (Alpha, α)
💡Sample Size
💡Statistical Significance
💡Mean
💡Proportion
💡Level of Confidence (C)
💡Research Hypothesis
Highlights
The lesson focuses on mastering statistics, specifically hypothesis testing.
Practice is emphasized for writing null and alternative hypotheses before performing full tests.
The null hypothesis represents the status quo belief, while the alternative hypothesis is the new claim or challenge.
Every hypothesis problem begins with extracting information and formulating the null and alternative hypotheses.
The problem of straw diameters is used as an example to illustrate how to write hypotheses without direction (greater or less than).
The importance of reading the problem carefully to determine the correct hypothesis symbols (equals, not equals, greater than, less than) is stressed.
The concept of mathematical opposites between the null and alternative hypotheses is introduced.
The example of average sleeping hours of teens demonstrates how to write hypotheses when the problem specifies direction (longer or shorter).
The significance of including an equal sign in hypotheses is explained in the context of 'no longer than' or 'at least'.
The transcript explains the relationship between the level of confidence (C) and the level of significance (alpha) in hypothesis testing.
The problem of students bringing phones to school is used to illustrate setting up hypotheses for a proportion rather than a mean.
The null and alternative hypotheses must be mutually exclusive and together cover all possible outcomes.
The number of samples used for testing is an important piece of information needed for hypothesis testing.
The level of significance (alpha) is given as a percentage, and its decimal equivalent is used in calculations.
The concept of hypothesis testing will be further explored in subsequent sections, including how to perform the test and interpret results.
The direction of the alternative hypothesis (greater than, less than, not equal) affects the method of hypothesis testing.
The lesson concludes with encouragement to practice formulating null and alternative hypotheses for better understanding in the next section.
Transcripts
Browse More Related Video
The basic steps of hypothesis testing

Session 45 - Hypothesis Testing Part 1 | DSMP 2023
Math 119 Chap 8 part 1
Hypothesis testing: step-by-step, p-value, t-test for difference of two means - Statistics Help
Elementary Statistics Chapter 8 - Introduction Hypothesis Testing Part 1 Lesson 1
8.1.2 Basics of Hypothesis Testing - Significance Level, Type I and Type II Error
5.0 / 5 (0 votes)
Thanks for rating: