How to Use SPSS: Choosing the Appropriate Statistical Test
TLDRThe video script offers a comprehensive guide on selecting the appropriate statistical analysis technique for research projects. It emphasizes the importance of understanding the nature of the research question, the type and number of variables involved, and the scale of measurement. The speaker outlines a step-by-step process that includes categorizing the research question into descriptive, correlational, or cause-and-effect types, and then matching these with suitable statistical methods such as descriptive analysis, correlational analysis, T-tests, ANOVA, and others. The script also discusses the necessity of meeting certain assumptions for parametric statistics, and if these are not met, the use of nonparametric statistics as an alternative. The guide is a valuable resource for researchers, particularly students, to make informed decisions about statistical analysis techniques.
Takeaways
- 🔍 **Identify Research Question Type**: Determine if the research question is descriptive, correlational, or about cause and effect to guide the choice of statistical analysis.
- 📊 **Analyze Variables**: Understand the type and number of variables involved, whether they are independent, dependent, categorical, or continuous, to align with the correct statistical method.
- ⚖️ **Scale of Measurement**: Recognize the scale of measurement for variables, such as nominal, ordinal, interval, or ratio, as it influences the statistical techniques applicable.
- 📈 **Descriptive Analysis**: Use basic statistical measures like mean, median, mode, and standard deviation for summarizing and describing data.
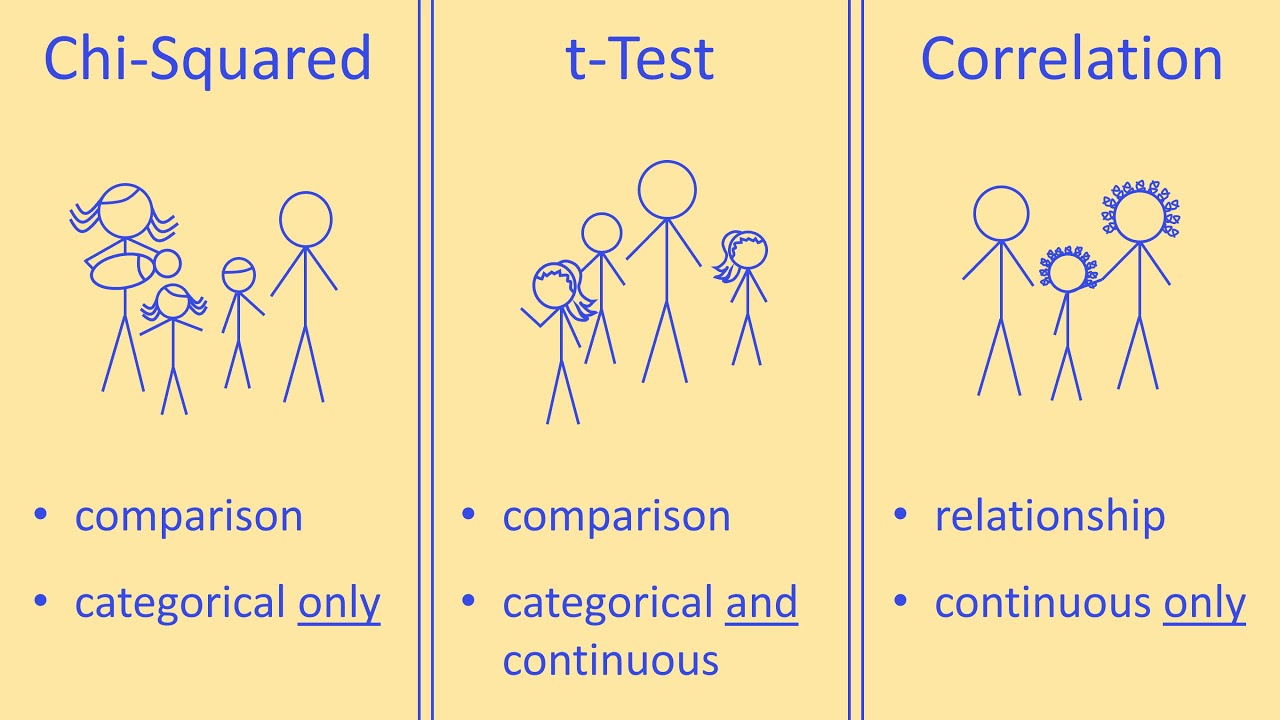
- 🔗 **Correlational Analysis**: Apply Pearson or Spearman correlation to examine the relationship between two continuous variables, or regression analysis for prediction.
- 🚦 **Group Comparisons**: Utilize T-tests and ANOVA for comparing group means when examining differences across various groups.
- 📈 **Understand Assumptions**: Ensure data meets the assumptions required for parametric tests, such as normality, or be prepared to use nonparametric alternatives.
- ➗ **Data Transformation**: Consider transforming data to meet assumptions of parametric tests when necessary, using methods like logarithmic transformation.
- 📝 **Operational Definitions**: Develop clear operational definitions for variables to standardize measurement and ensure consistency in data collection.
- 📋 **Diagrammatic Representation**: Create diagrams or visual representations to help conceptualize the research design and the relationships between variables.
- ✅ **Final Decision**: After evaluating all factors, make an informed decision on the most appropriate statistical analysis technique for the research question and data at hand.
Q & A
What is the primary challenge in the research process that the speaker mentions?
-The primary challenge mentioned by the speaker is choosing the correct statistical technique to analyze data.
What are the three main types of research questions that can be asked?
-The three main types of research questions are descriptive, correlational or predictive, and cause-and-effect or group differences.
What is the purpose of descriptive analysis in statistics?
-Descriptive analysis is used to determine the frequency of something occurring, measure central tendency, variance, and develop standard scores, providing a summary of the data.
What is the difference between a Pearson correlation and a Spearman correlation?
-Pearson correlation is used to determine the relationship between two continuous or numeric variables, while Spearman correlation is a nonparametric measure that can be used for ordinal or ranked data.
What is a T-test used for?
-T-tests are used to compare the mean scores between two groups on a continuous or numeric outcome variable, such as males versus females or pre- and post-test scores.
What is the main advantage of using a factorial ANOVA?
-The main advantage of using a factorial ANOVA is that it allows testing for interaction effects between two or more independent variables on a dependent variable, as well as the main effects of each independent variable.
What is the role of an operational definition in a research study?
-An operational definition specifies exactly how each variable will be measured or defined in the study, which is crucial for clarity and replicability of research.
Why is it important to consider the level of measurement for each variable in a study?
-The level of measurement (nominal, ordinal, interval, or ratio) determines the type of statistical analysis that can be used, as different scales require different analytical techniques.
What is the significance of normal distribution in parametric statistics?
-Normal distribution is a key assumption in parametric statistics because it affects the validity of the results. If the data is not normally distributed, the assumptions of the test may be violated, potentially leading to incorrect conclusions.
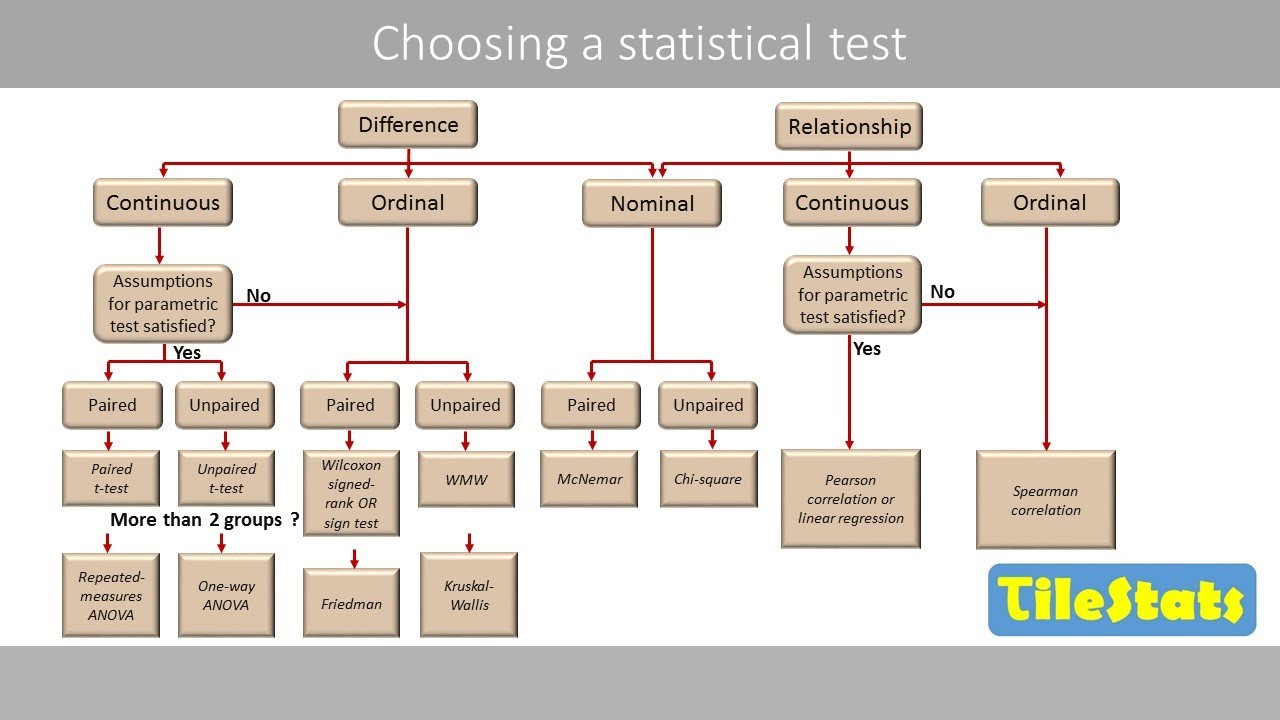
What are the steps involved in choosing the right statistical analysis technique?
-The steps include identifying the type of research question, defining the variables, determining the nature of the variables, deciding on parametric or nonparametric analysis, and making a final decision on the analysis technique based on the gathered information.
Why might a researcher choose to use nonparametric statistics instead of parametric statistics?
-A researcher might choose nonparametric statistics when the data does not meet the assumptions required for parametric tests, such as normal distribution, or when the data is ordinal or categorical in nature.
Outlines
🔍 Introduction to Choosing Statistical Analysis Techniques
The paragraph introduces the challenge of selecting the appropriate statistical method for analyzing data in research projects. It emphasizes the importance of understanding different statistical tasks, the nature of research questions, and the underlying assumptions. The video aims to guide viewers through a step-by-step process to match their research design with the right analysis technique, considering multiple research questions and designs that may require different statistical approaches.
📊 Descriptive, Correlational, and Inferential Analysis Overview
This paragraph delves into the types of statistical analyses: descriptive, correlational, and analysis of differences between groups. Descriptive analysis involves measures of central tendency and variance. Correlational analysis includes Pearson and Spearman correlations to determine the relationship between variables. Analysis of group differences covers T-tests, ANOVA, and post hoc comparisons to compare mean scores across groups. Factorial ANOVA is introduced for assessing the impact of two or more independent variables on a dependent variable, including interaction effects.
📈 Identifying Research Questions and Variables
The focus of this paragraph is on identifying the type of research question being asked and the variables involved. It outlines the categorization of research questions into descriptive, correlational, and cause-and-effect types. The paragraph also discusses the necessity of defining independent and dependent variables, operationalizing these variables, and understanding the expected range of scores for each.
📊 Measurement Scales and Data Characteristics
The paragraph discusses the importance of identifying the level of measurement for each variable, which can be nominal, ordinal, interval, or ratio. It also addresses additional considerations for numeric variables, such as normal distribution and the presence of outliers. For categorical variables, it considers group balance and the possibility of empty categories. The step of diagramming the analysis to visualize the process is introduced as a helpful tool.
🤔 Determining Parametric and Nonparametric Analysis
This paragraph explores the decision between parametric and nonparametric statistical analysis. It highlights the conditions and assumptions required for parametric statistics, such as normal distribution. If these assumptions are not met, the paragraph suggests data transformation or the use of nonparametric techniques as alternatives. It also provides examples of nonparametric alternatives to common parametric tests.
📝 Final Analysis Technique Decision and Examples
The paragraph outlines the final step in selecting a statistical analysis technique, which involves considering the type of research question, characteristics of variables, and meeting assumptions for various techniques. It suggests looking at similar published studies for guidance. Several examples are provided to illustrate the process, covering different research questions and the corresponding statistical tests that would be appropriate for each scenario, including chi-square tests, t-tests, ANOVA, and MANOVA.
📚 Summary of the Statistical Analysis Selection Process
The final paragraph summarizes the six-step approach for determining the appropriate statistical analysis technique based on research design and collected data. It reiterates the importance of understanding the type of research question, the characteristics of the variables involved, and the assumptions underlying different statistical techniques. The goal is to guide researchers in making informed decisions about the statistical analysis methods to use in their research.
Mindmap
Keywords
💡Statistical Analysis
💡Descriptive Research Question
💡Correlational Analysis
💡Causal-Effect Question
💡Independent and Dependent Variables
💡Measurement Scales
💡Parametric and Nonparametric Statistics
💡Data Transformation
💡Chi-Square Test of Independence
💡Repeated Measures ANOVA
💡Factorial ANOVA
Highlights
The video demonstrates a process to determine the appropriate statistical analysis based on collected data and research design.
Choosing the correct statistical technique can be a challenging part of the research process, especially for students.
The video emphasizes the importance of understanding different statistical tasks, questions, and underlying assumptions.
Research questions can be categorized into three main types: descriptive, correlational/predictive, and cause-and-effect/group differences.
Descriptive research aims to describe a group of subjects or data without intervention.
Correlational analysis is used to establish relationships between variables or predict one another.
Cause-and-effect questions compare groups to identify statistically significant differences.
Descriptive analysis includes determining frequency, percent, percentile ranks, and measures of central tendency.
Correlational analysis techniques include Pearson and Spearman correlation to evaluate the relationship between two variables.
Regression analysis is used to predict outcomes based on the relationship between independent and dependent variables.
T-tests are used to compare mean scores between two groups, with types being paired/dependent and independent samples.
ANOVA is used to analyze differences between three or more groups, with one-way and factorial ANOVA being common types.
Factorial ANOVA allows testing for interaction effects between independent variables on a dependent variable.
MANOVA is used when comparing groups on multiple related outcome variables.
The step-by-step process involves identifying the research question, variables, their nature, and the scale of measurement.
Operational definitions for each variable are crucial for clarity in statistical analysis.
Understanding the normal or expected range of scores for variables is important for analysis decisions.
Diagramming the analysis can help visualize and choose the correct statistical technique.
Parametric vs. nonparametric statistical analysis depends on whether the data meets parametric assumptions, such as normal distribution.
If parametric assumptions are not met, data transformation or nonparametric techniques can be considered.
The final decision on the analysis technique should consider the research question, variable characteristics, and met assumptions.
Transcripts
Browse More Related Video

Quantitative Data Analysis 101 Tutorial: Descriptive vs Inferential Statistics (With Examples)
Choosing a Statistical Test for Your IB Biology IA
How to choose an appropriate statistical test

Research Design: Choosing a Type of Research Design | Scribbr 🎓

Nominal, Ordinal, Interval & Ratio Data: Simple Explanation With Examples
Statistics Terminology and Definitions| Statistics Tutorial | MarinStatsLectures
5.0 / 5 (0 votes)
Thanks for rating: