Power Analysis, Clearly Explained!!!
TLDRIn this informative video, Josh Starmer from StatQuest dives into the concept of power analysis in statistics. He explains the importance of power analysis in determining the sample size needed to ensure a high probability of correctly rejecting the null hypothesis when comparing two groups. Josh illustrates the impact of sample size on the accuracy of estimated means and the overlap between two distributions. He emphasizes the need to avoid p-hacking and instead use power analysis to make informed decisions. The video also covers how to calculate effect size and use online power calculators to find the optimal sample size for a given power level and significance threshold. Josh concludes by stressing the significance of high power in statistical analysis for making confident conclusions.
Takeaways
- 🧠 Power analysis is a statistical method to determine the sample size needed to ensure a high probability of correctly rejecting the null hypothesis in a study.
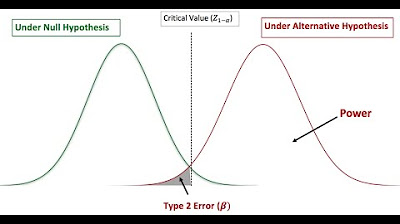
- 💡 Understanding power (the probability of correctly rejecting a false null hypothesis) is crucial for avoiding p-hacking and making reliable conclusions from research data.
- 🧬 The main factors affecting power are the degree of overlap between the two distributions being studied and the sample size.
- 📊 Comparing means with different sample sizes illustrates how increasing the number of measurements reduces the variability in estimated means and increases confidence in the estimates.
- 🔍 A larger sample size reduces the impact of extreme measurements, leading to more accurate estimates of the population mean and higher power.
- 📈 Effect size (often denoted as d) is a metric that combines the distance between population means and standard deviations, aiding in the determination of required sample size for a study.
- 🔢 Power analysis can be conducted using online statistics power calculators, which require inputs such as desired power, significance threshold (alpha), and estimated effect size.
- 🌟 The central limit theorem states that the distribution of sample means approaches a normal distribution regardless of the underlying distribution, which supports the applicability of power analysis.
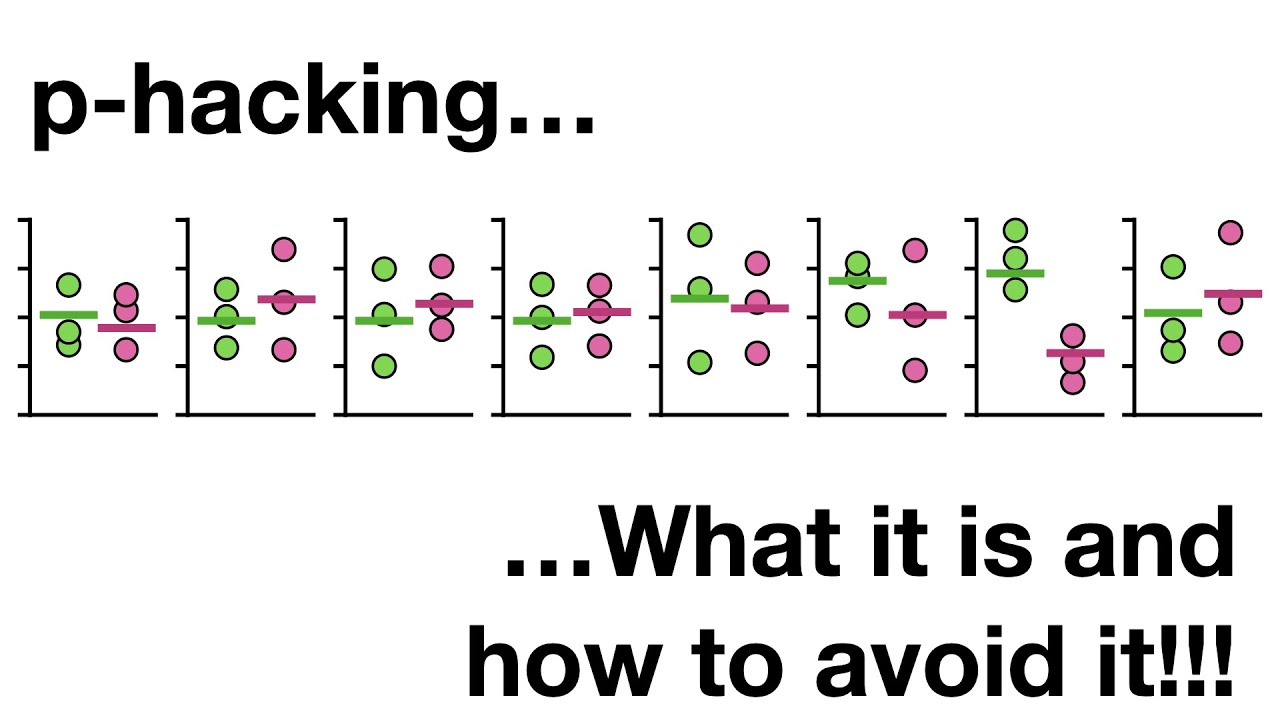
- 🚫 P-hacking, or manipulating data to achieve a desired p-value, should be avoided as it undermines the integrity and reliability of statistical analysis.
- 🧪 In clinical trials or experiments, power analysis is essential to design studies that can detect meaningful differences between treatments or conditions with sufficient precision.
- 📝 Estimating population parameters and effect sizes can be done using prior data, literature reviews, or educated guesses when concrete data is not available.
Q & A
What is the main topic of the StatQuest video?
-The main topic of the video is power analysis, which is used to determine the sample size necessary to ensure a high probability of correctly rejecting the null hypothesis in statistical tests.
Why is it important to understand power analysis?
-Understanding power analysis is important because it helps avoid p-hacking and ensures that the sample size is large enough to make a good decision, increasing the confidence in the results of the statistical tests.
What does a p-value of 0.06 indicate in the context of the video example?
-A p-value of 0.06 indicates that there is a 6% chance of observing the data if the null hypothesis is true. Since it is greater than the threshold of 0.05, it does not provide enough evidence to reject the null hypothesis that drug A and drug B have the same effect.
What is the relationship between overlap and sample size in power analysis?
-The relationship between overlap and sample size is such that the more overlap there is between the two distributions being studied, the larger the sample size needs to be to achieve a certain level of power. Conversely, less overlap allows for a smaller sample size to achieve the same power.
How does the central limit theorem relate to power analysis?
-The central limit theorem states that the distribution of sample means approaches a normal distribution as the sample size becomes large, regardless of the shape of the population distribution. This means that the results of power analysis, which often rely on comparing means, apply to any underlying distribution when the sample size is sufficiently large.
What are the two main factors that affect power in a study?
-The two main factors that affect power are the degree of overlap between the two distributions being compared and the sample size, which refers to the number of measurements collected from each group.
How does the estimated mean vary with different sample sizes?
-With smaller sample sizes, the estimated mean can vary greatly due to individual outliers having a larger impact. As sample size increases, the influence of extreme values lessens, and the estimated means become more stable and closer to the true population mean.
What is the significance of having a high power in a statistical test?
-A high power in a statistical test, such as 0.8 or 80%, means that there is a high probability of correctly rejecting the null hypothesis when it is false. This reduces the chance of making a Type II error, which is failing to detect a true effect.
How can one estimate the effect size for power analysis?
-The effect size can be estimated by calculating the difference in means divided by the pooled standard deviation. This metric helps in determining the sample size needed to achieve a certain level of power for detecting a meaningful difference between groups.
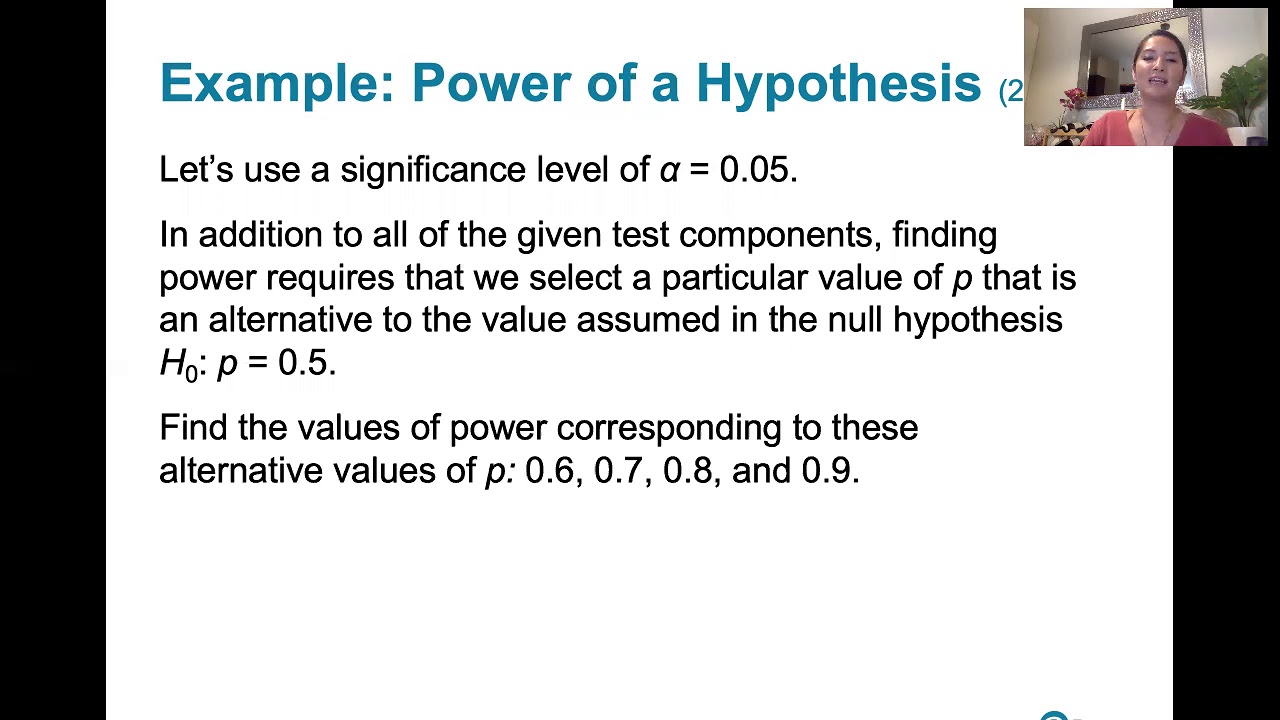
What is the recommended threshold for significance (alpha) in the video?
-The recommended threshold for significance, or alpha, in the video is 0.05. This means that there is a 5% chance of rejecting the null hypothesis when it is actually true, which is considered an acceptable level of risk in many statistical tests.
How can one determine the sample size needed for a desired power?
-To determine the sample size needed for a desired power, one must know the desired power level (commonly 0.8), the significance threshold (alpha, often 0.05), and the estimated effect size. These values can be input into a statistics power calculator to obtain the required sample size.
What is the role of prior data or literature search in power analysis?
-Prior data or a literature search can provide estimates for the population mean and standard deviation, which are crucial parameters for calculating the effect size and, subsequently, the required sample size for a power analysis.
Outlines
🧠 Introduction to Power Analysis
This paragraph introduces the concept of power analysis in the context of statistical testing. It begins with a scenario involving two drugs for treating a virus, where a preliminary comparison suggests that Drug A might be more effective. However, a statistical test yields a p-value greater than the significance threshold, preventing a definitive conclusion. The paragraph emphasizes the importance of understanding power analysis to avoid 'p-hacking' and to determine the appropriate sample size for future experiments. It also touches on the concepts of population parameters, estimated population parameters, and the goal of power analysis: to ensure a high probability of correctly rejecting the null hypothesis.
📊 Variability in Estimated Means
This paragraph delves into the variability of estimated means when different sample sizes are used. It explains how using a single measurement to estimate the population mean can lead to significant variation and uncertainty. The paragraph uses the example of estimating the mean for two different drugs and illustrates how collecting more measurements reduces the impact of outliers and leads to more reliable estimates. It also discusses the concept of the central limit theorem and its relevance to power analysis, regardless of the underlying distribution.
🧮 Determining Sample Size through Power Analysis
This paragraph explains the process of conducting a power analysis to determine the necessary sample size for an experiment. It outlines the factors that influence power, such as the desired level of power, the significance threshold (alpha), and the effect size, which combines the distance between means and standard deviations. The paragraph provides a practical example of calculating the pooled standard deviation and effect size using data from the two drugs. It concludes with the use of an online statistics power calculator to find the required sample size for achieving a power of 0.8, given the effect size and significance threshold.
🚀 Conclusion: The Importance of Sample Size
The final paragraph summarizes the key takeaways from the discussion on power analysis. It reiterates the importance of a large sample size in increasing the confidence in estimated means and the probability of correctly rejecting the null hypothesis. The paragraph contrasts the low power associated with small sample sizes and high variability with the high power achievable through larger sample sizes, even in cases where distributions overlap. It concludes with a call to action for viewers to support the StatQuest channel through various means and ends with a sign-off until the next episode.
Mindmap
Keywords
💡Power Analysis
💡Statistical Significance
💡P-Hacking
💡Population Parameters
💡Estimated Population Parameters
💡Effect Size
💡Sample Size
💡Overlapping Distributions
💡Central Limit Theorem
💡Null Hypothesis
Highlights
StatQuest introduces the concept of power analysis, an essential tool in statistics for determining the appropriate sample size for experiments.
Power analysis helps to avoid p-hacking by ensuring a high probability of correctly rejecting the null hypothesis.
The example used in the video involves comparing two drugs for treating a virus based on recovery times.
A statistical test is performed to compare the means of the two drugs, resulting in a p-value of 0.06, which is above the 0.05 threshold for significance.
The concept of power is explained, with an emphasis on its importance in making reliable decisions based on statistical evidence.
Two main factors affecting power are the overlap between the two distributions and the sample size.
The video illustrates how the estimated means can vary significantly from the population mean, especially with small sample sizes.
As sample size increases, the estimated means become more stable and closer to the population mean, reducing the impact of extreme values.
The central limit theorem is mentioned, emphasizing that the results apply to any underlying distribution, not just normal distributions.
A step-by-step guide on how to perform a power analysis is provided, including determining the desired power, significance threshold, and estimating the overlap between distributions.
Effect size is introduced as a metric to combine the distance between means and standard deviations, with a common method provided for its calculation.
Using an online statistics power calculator is recommended to determine the required sample size based on the desired power, significance level, and effect size.
The video concludes with a summary that emphasizes the importance of large sample sizes for high power and the ability to confidently reject the null hypothesis.
StatQuest encourages viewers to subscribe for more content and offers various ways to support the channel, including Patreon and merchandise.
Transcripts


5.0 / 5 (0 votes)
Thanks for rating: