Statistics 101: Logistic Regression, Logit and Regression Equation
TLDRThis video delves into the mathematical aspects of logistic regression, focusing on the relationship between binary dependent variables and independent variables. It explains the concept of the Bernoulli distribution, the logit function as a link between variables, and the inverse logit for estimating probabilities. The video also touches on the use of maximum likelihood estimation for calculating regression coefficients and concludes with a discussion on the estimated regression equation for logistic regression, setting the stage for practical application in the next video.
Takeaways
- 📊 Logistic regression involves math and statistics to link probabilities between 0 and 1 to independent variables.
- 🔗 The dependent variable in logistic regression is binary, either 0 or 1, following the Bernoulli distribution.
- 🤔 The goal of logistic regression is to estimate the probability (p) for a given linear combination of independent variables.
- 📈 The logit function is used to link independent variables to the Bernoulli distribution on the dependent side.
- 📝 The logit is defined as the natural log of the odds (p/(1-p)) and is the log odds ratio.
- 🚫 The logit function is undefined at probabilities of 0 and 1, which is useful when dealing with probabilities.
- 📌 At a probability of 0.5, the logit function crosses the x-axis at (0.5, 0), indicating even odds.
- 📊 The inverse logit function, or the mean function, returns the probability of the event occurring (being a '1') and is used to map the linear combination of variables back to probabilities.
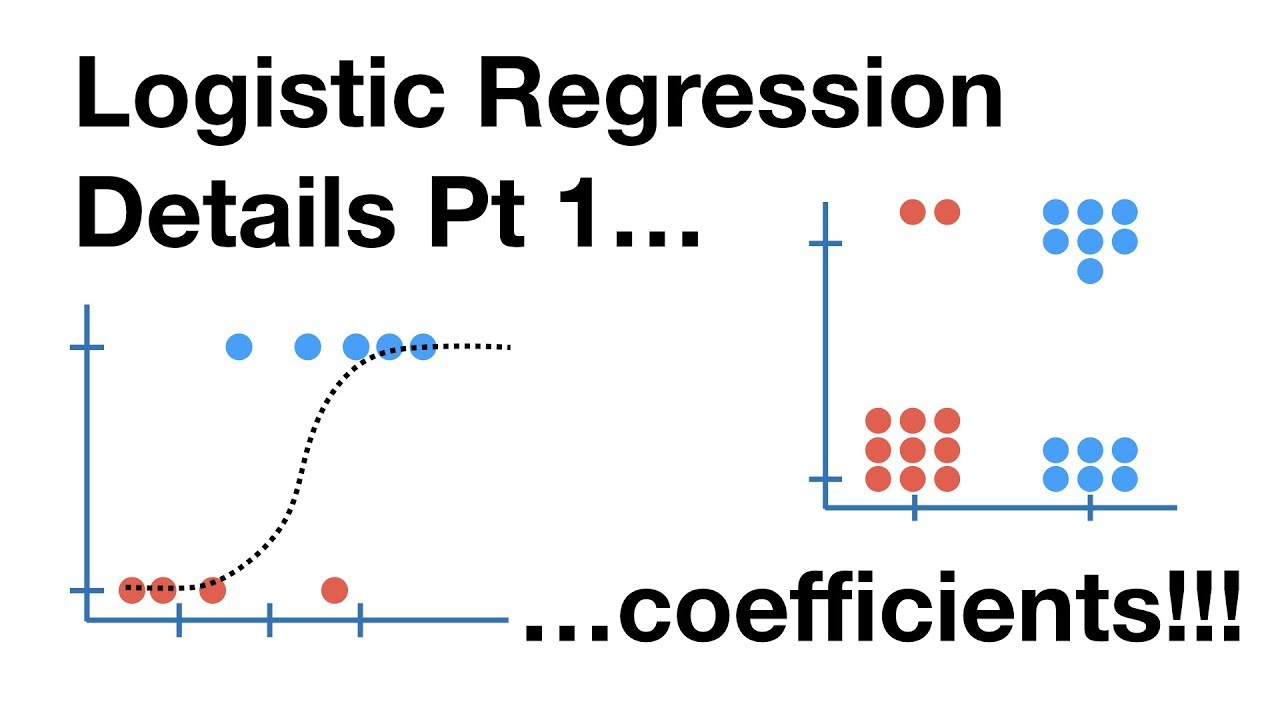
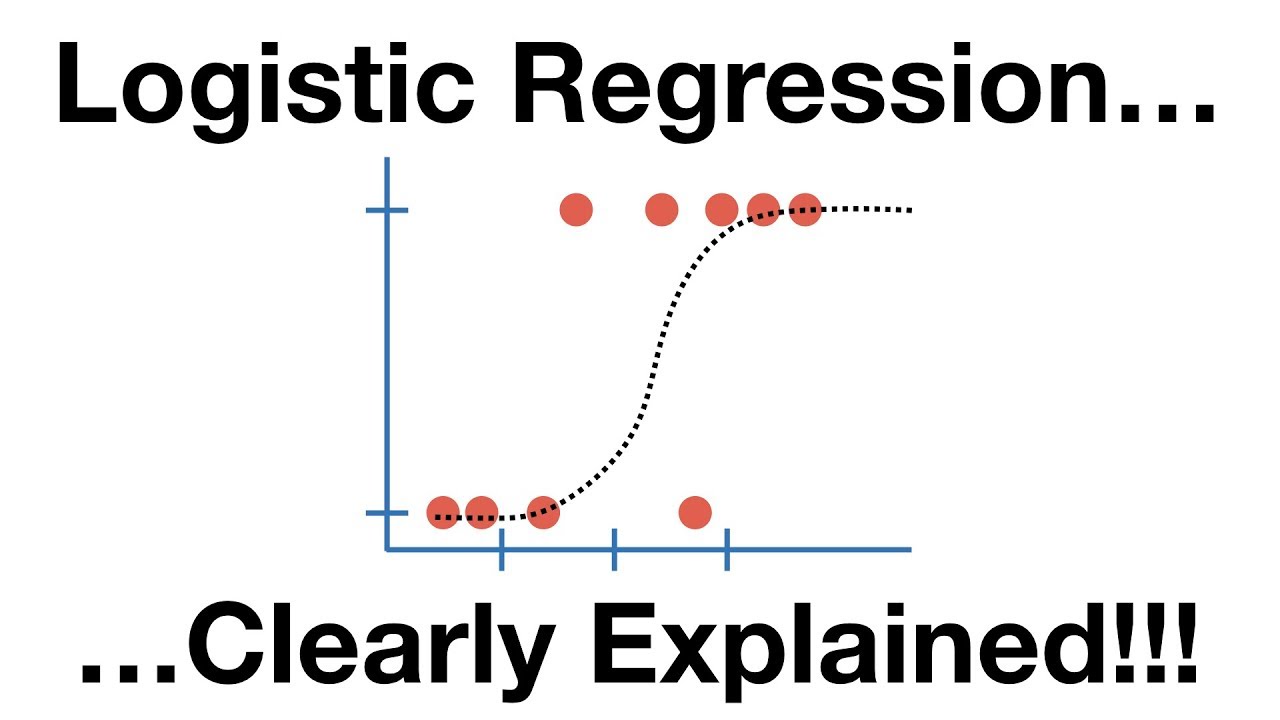
- 📈 The inverse logit function forms an 'S' curve or sigmoid curve, which is a key shape in logistic regression.
- 🧮 The coefficients in logistic regression are calculated using maximum likelihood estimation (MLE), a different algorithm from least squares regression.
Q & A
What is the main focus of the video?
-The main focus of the video is to explain the concept of logistic regression, particularly how to link probabilities between zero and one to independent variables using the logit function.
Why is the dependent variable in logistic regression important?
-The dependent variable in logistic regression is important because it is binary, meaning it can either be zero or one. This characteristic is crucial for understanding how to estimate probabilities based on the independent variables.
What is the Bernoulli distribution in the context of logistic regression?
-In the context of logistic regression, the Bernoulli distribution is the probability distribution of the dependent variable, which can take on two possible values, 'success' (labeled as 1) or 'failure' (labeled as 0). The probability of success, p, is unknown and must be estimated.
How does the logit function serve as a link between independent variables and the Bernoulli distribution?
-The logit function serves as a link by mapping the linear combination of independent variables to the domain of the Bernoulli distribution, which is between zero and one. It is the natural log of the odds ratio (p/q), where p is the probability of success and q is the probability of failure.
What is the inverse logit function and why is it used?
-The inverse logit function is the inverse of the logit function and is used to estimate the probability of the dependent variable being one (the 'success' outcome). It transforms the log odds, which can take on any value, back into the range of probabilities between zero and one.
What is the S-curve or sigmoid curve in logistic regression?
-The S-curve or sigmoid curve in logistic regression is the graphical representation of the inverse logit function. It is an S-shaped curve that shows how the estimated probability of the 'success' outcome changes with the independent variables.
How are the coefficients in logistic regression calculated?
-The coefficients in logistic regression are calculated using maximum likelihood estimation (MLE), which is a different algorithm from the least squares method used in simple and multiple linear regression.
Why is the logit function undefined at p equals zero and one?
-The logit function is undefined at p equals zero and one because the natural log of zero (ln(0)) and the natural log of a negative number (ln(1/0)) are both undefined. This property is useful when dealing with probabilities, as it prevents the function from estimating probabilities outside the valid range of zero to one.
What is the estimated regression equation for logistic regression?
-The estimated regression equation for logistic regression is p-hat equals e^(linear combination of independent variables) divided by (1 + e^(linear combination of independent variables)), where p-hat is the estimated probability of the dependent variable being one.
How does the estimated regression equation relate to the logistic regression model?
-The estimated regression equation is used to fit the logistic regression model to the data. It incorporates the coefficients obtained from the analysis to estimate the probability of the dependent variable being one based on the values of the independent variables.
What is the significance of the graph of the inverse logit function?
-The graph of the inverse logit function, or the S-curve, is significant because it visually demonstrates how the probability of the 'success' outcome increases or decreases as the independent variables change. It is a key component in understanding and interpreting logistic regression models.
Outlines
📚 Introduction to Logistic Regression
This paragraph introduces the topic of logistic regression, emphasizing its mathematical nature due to the statistical context. The speaker, Brandon, welcomes viewers to the video and encourages interaction by asking for likes, shares, and subscriptions. He sets the stage for the video by mentioning that logistic regression deals with a binary dependent variable, either zero or one, and the goal is to link probabilities between zero and one to independent variables. The video aims to explain this linkage using diagrams and graphs for better understanding. Brandon also introduces the Bernoulli distribution, which is pertinent to logistic regression, and explains the concept of success and failure in this context.
📈 Understanding the Logit Function
In this paragraph, Brandon delves deeper into the logistic regression by discussing the logit function, which serves as the link between the independent variables and the Bernoulli distribution. He clarifies the pronunciation of 'logit' and explains its mathematical representation as the natural log of the odds ratio. Brandon uses graphs to illustrate the logit function, noting its undefined nature at zero and one, which is beneficial when dealing with probabilities. He also highlights the significance of the logit being zero when the probability p is 0.5, indicating equal odds. The paragraph concludes with an introduction to the inverse logit function, which is essential for understanding logistic regression and its application in estimating probabilities.
📊 Graphing the Inverse Logit Function
This paragraph focuses on the graphical representation of the inverse logit function, which is crucial for understanding logistic regression. Brandon explains that the inverse logit function is derived by taking the inverse of the logit function, effectively swapping the x and y axes. He describes the graph as an 'S' curve or sigmoid curve, emphasizing its importance in logistic regression. The paragraph also revisits the original scatterplot from a previous video, discussing how the estimated regression equation will fit this 'S' curve. Brandon touches on the concept of maximum likelihood estimation (MLE) for calculating regression coefficients in logistic regression, noting that it operates behind the scenes and is beyond the scope of the video series.
🧮 Deriving the Estimated Regression Equation
The final paragraph of the video script is dedicated to deriving the estimated regression equation for logistic regression. Brandon outlines the process of isolating the probability variable 'p' using algebra and logarithmic rules. He presents the estimated regression equation, which includes the Euler constant raised to the power of a linear combination of independent variables, divided by a denominator that also involves the Euler constant. The paragraph emphasizes that once the coefficients are obtained from statistical software, they can be substituted into this equation to estimate the probability for any given values. Brandon concludes the video by stating that the next installment will involve running the regression, interpreting the coefficients, and understanding the output from statistical software like Minitab.
Mindmap
Keywords
💡Logistic Regression
💡Bernoulli Distribution
💡Probability (p)
💡Logit Function
💡Inverse Logit Function
💡Odds Ratio
💡Maximum Likelihood Estimation (MLE)
💡Coefficients
💡Estimated Regression Equation
💡Sigmoid Curve
💡Natural Logarithm
Highlights
Introduction to logistic regression and its mathematical nature.
Explanation of the binary dependent variable in logistic regression.
Linking probabilities to independent variables through the Bernoulli distribution.
Description of the Bernoulli distribution and its relation to the binomial distribution.
The concept of odds in the context of Bernoulli distribution.
Estimation of an unknown probability p for a linear combination of independent variables.
Definition and pronunciation of the term 'logit'.
Explanation of the logit function and its role in logistic regression.
Graph of the logit function and its characteristics.
Discussion on the inverse logit function and its importance in logistic regression.
Graph of the inverse logit function and its S-curve or sigmoid shape.
Application of logistic regression in estimating probabilities, such as the likelihood of sleep apnea or mortgage approval.
Explanation of how the estimated regression equation is derived in logistic regression.
Discussion on the coefficients in logistic regression and their calculation using maximum likelihood estimation.
The final estimated regression equation for logistic regression and its components.
Transcripts
Browse More Related Video


5.0 / 5 (0 votes)
Thanks for rating: