Logistic Regression in 3 Minutes
TLDRLogistic regression, a statistical technique, predicts binary outcomes based on independent variables. The S-shaped logistic function models probabilities, with maximum likelihood estimation used to fit the curve to data points. By adjusting thresholds, predictions can be fine-tuned for accuracy. The video also touches on handling false positives/negatives and using confusion matrices for performance tracking, with further exploration in upcoming videos.
Takeaways
- 📊 Logistic regression is a statistical technique used to model the probability of binary outcomes based on one or more independent variables.
- 📈 The logistic function is an S-shaped curve that fits the data to make probability predictions, such as the likelihood of an event occurring given certain conditions.
- 🔍 Maximum likelihood estimation is used to fit the logistic curve to the data by finding the beta coefficients that maximize the likelihood of the observed outcomes.
- 🎯 The logistic function can be represented by the formula involving the Euler number 'e' and a linear combination of the input variables, known as the log odds function.
- 🌡️ An example given in the script is predicting the probability of a flood based on the amount of rain, illustrating how the logistic function can be applied to real-world scenarios.
- 📍 The logistic curve allows for the projection of data points, which can be used to estimate the probability of an event occurring within a certain threshold.
- 🚀 The script mentions the use of optimization techniques like gradient descent and Newton's method to find the best-fitting logistic curve for the data.
- 🔄 The script explains the treatment of false cases as positive in the context of maximizing likelihood, which will be covered in more depth in a future video.
- 📚 The speaker recommends their books for further reading on SQL and essential math for data science, including a more in-depth look at logistic regression and classification algorithms.
- 🔢 Multi-dimensional logistic regressions can be created by extending the model to include more input variables, allowing for more complex predictions.
- 🛡️ The script introduces the concept of a confusion matrix as a tool for tracking prediction performance, including handling false positives and false negatives.
Q & A
What is logistic regression?
-Logistic regression is a statistical technique used to model the probability of events based on one or more independent variables, with the output variable being binary, indicating a true or false value.
What type of data does logistic regression require for input?
-Logistic regression requires input data that can be of any numeric type, but the output variable must be binary, taking values of zero or one.
What is the logistic function?
-The logistic function is an S-shaped curve that is fit to the data in logistic regression to model the probability of an event occurring.
How does the logistic function help in making predictions?
-The logistic function allows for the projection of data points onto itself, and using maximum likelihood estimation, it can fit the curve to make predictions about the probability of an event.
What is maximum likelihood estimation?
-Maximum likelihood estimation is a method used to fit the logistic curve by finding the beta coefficients that maximize the likelihood of the curve producing all the given data points.
How can the logistic function be used to predict probabilities between 0 and 1?
-The logistic function can be leveraged to predict probabilities by interpreting the output values, which range between 0 and 1, as the likelihood of an event occurring.
What is a threshold in the context of logistic regression predictions?
-A threshold is a predefined value that determines the classification of the output. If the predicted probability is greater than the threshold, the event is classified as 'true'; if less, it is 'false'.
How can the threshold be adjusted to change the classification of predictions?
-The threshold can be adjusted according to the needs. A higher threshold makes it more stringent for an event to be classified as 'true', while a lower threshold makes it easier to classify as 'true'.
Can logistic regression be extended to handle more than one input variable?
-Yes, logistic regression can be extended to handle multiple input variables, creating multi-dimensional logistic regressions.
What are some optimization techniques used to find the beta coefficients in logistic regression?
-Gradient descent, Newton's method, and other optimization techniques can be used to find the beta coefficients that maximize the likelihood of the logistic curve fitting the data points.
Why are false cases treated as positive in maximum likelihood estimation?
-False cases are treated as positive to ensure that they are also maximized during the estimation process, which helps in fitting the logistic curve accurately for all data points.
What is a confusion matrix and how is it used in logistic regression?
-A confusion matrix is a tool used to evaluate the performance of predictions in classification problems. It tracks true positives, false positives, true negatives, and false negatives to assess the accuracy and reliability of the logistic regression model.
Outlines
📊 Introduction to Logistic Regression
The paragraph introduces logistic regression as a statistical method for modeling the probability of events given one or more independent variables. It explains that the input data can be of any numeric type, but the output is binary, indicating a true or false value. The logistic function, an S-shaped curve, is used to fit the data and make predictions about the likelihood of an event, such as the probability of a flood given a certain amount of rain. The concept of maximum likelihood estimation is briefly mentioned, along with the logistic function's role in projecting data points and fitting the curve. The paragraph also touches on adjusting thresholds for classifying events based on the logistic curve.
Mindmap
Keywords
💡Logistic Regression
💡Binary Output
💡Logistic Function
💡Maximum Likelihood Estimation (MLE)
💡Beta Coefficients
💡Log Odds
💡Threshold
💡False Positives and False Negatives
💡Confusion Matrix
💡Gradient Descent
💡Multi-Dimensional Logistic Regression
Highlights
Logistic regression models the probability of events given one or more independent variables.
Input data can be of any numeric type, while the output variable is binary, indicating a false or true value.
The logistic function is an s-shaped curve used to fit the data for making predictions.
Maximum likelihood estimation is used to fit the logistic curve to the data points.
The logistic function can project points and use them to predict probabilities of events, such as the likelihood of a flood.
Thresholds can be adjusted to define what constitutes a 'true' or 'false' prediction based on the probability.
The logistic function is defined by the constant e and a linear function representing the log odds.
Logistic regression can be extended to multi-dimensional inputs for more complex models.
Maximum likelihood estimation involves multiplying the likelihoods of each point to find the total likelihood.
Beta coefficients are found using optimization techniques to maximize the likelihood of the logistic curve fitting the data.
False cases are treated as positive in the estimation process to ensure they are also maximized.
A confusion matrix is a tool used to track the performance of predictions, including false positives and false negatives.
The video provides resources for further learning, including two books on SQL and essential math for data science.
The logistic function's role in classification algorithms is covered in depth in the book 'Essential Math for Data Science'.
The video concludes with an invitation to like, subscribe, and share for more content on data science.
Transcripts
Browse More Related Video
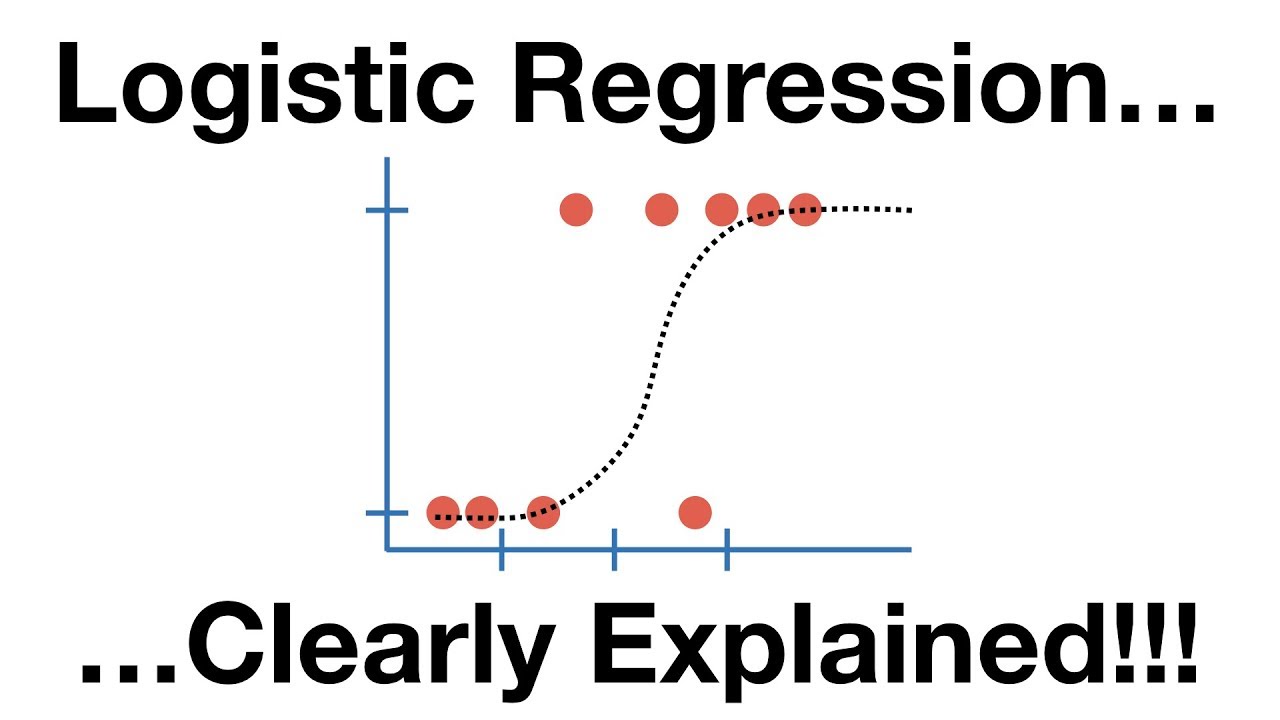
StatQuest: Logistic Regression

Statistics 101: Logistic Regression, Logit and Regression Equation

The ROC Curve (Receiver-Operating Characteristic Curve) — Topic 84 of Machine Learning Foundations
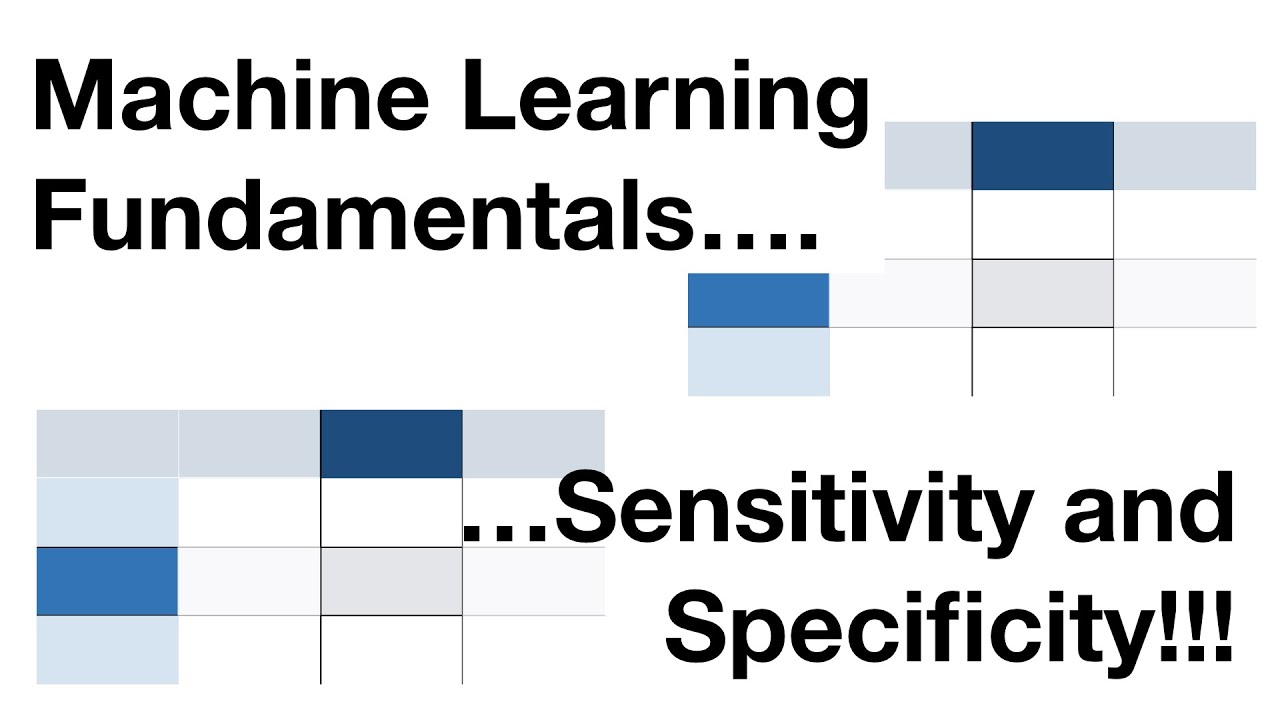
Machine Learning Fundamentals: Sensitivity and Specificity
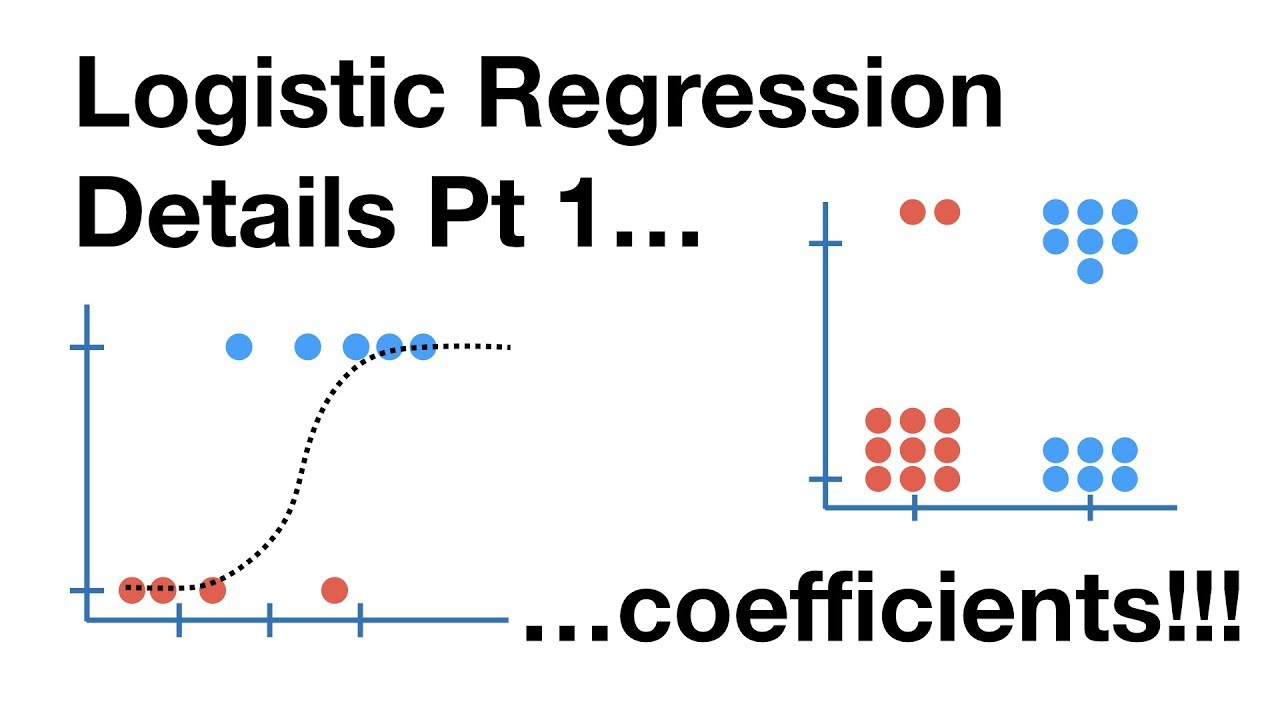
Logistic Regression Details Pt1: Coefficients
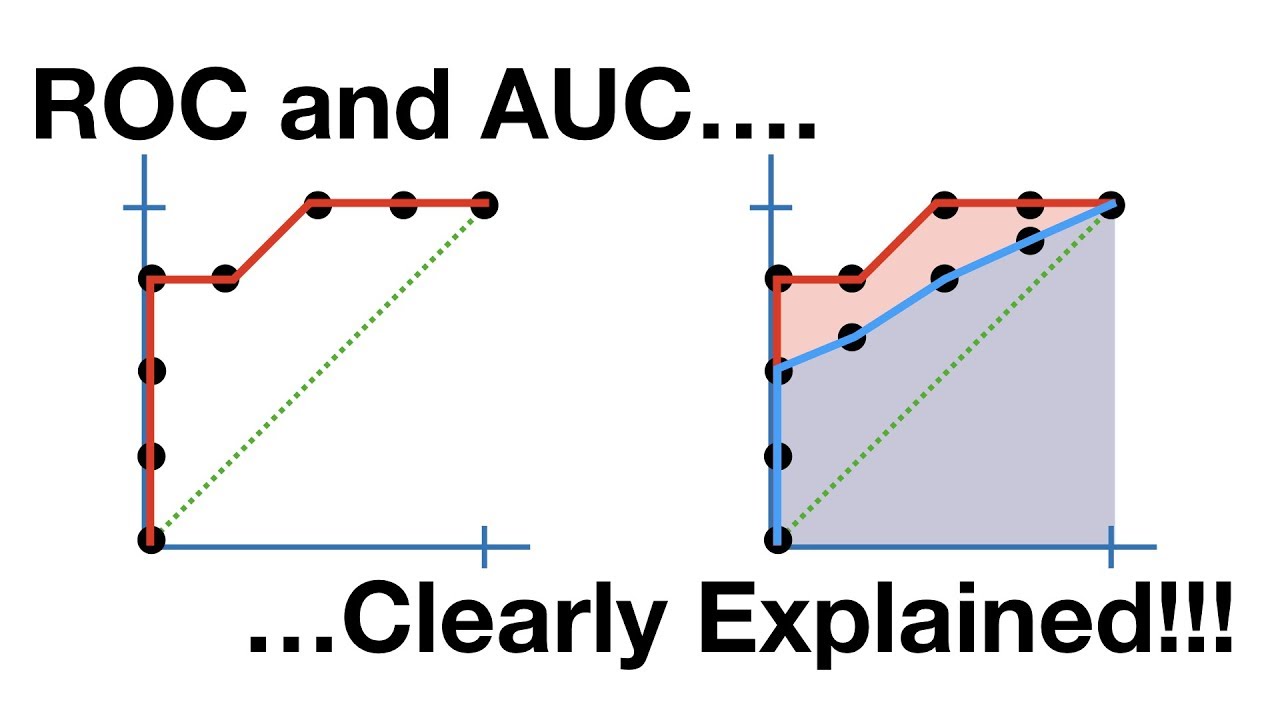
ROC and AUC, Clearly Explained!
5.0 / 5 (0 votes)
Thanks for rating: